Node Details
This article refers to Platform v3.2.0. The current Platform version is v3.4.0.
Overview
The Node Details page is the operational hub for a single edge node. It groups everything you can observe and change about a node — telemetry, configuration, network, deployed apps — behind a card-based layout on the Node Info tab, a Workloads tab for managing running applications, and a persistent Log Viewer panel for live log access.
Page layout
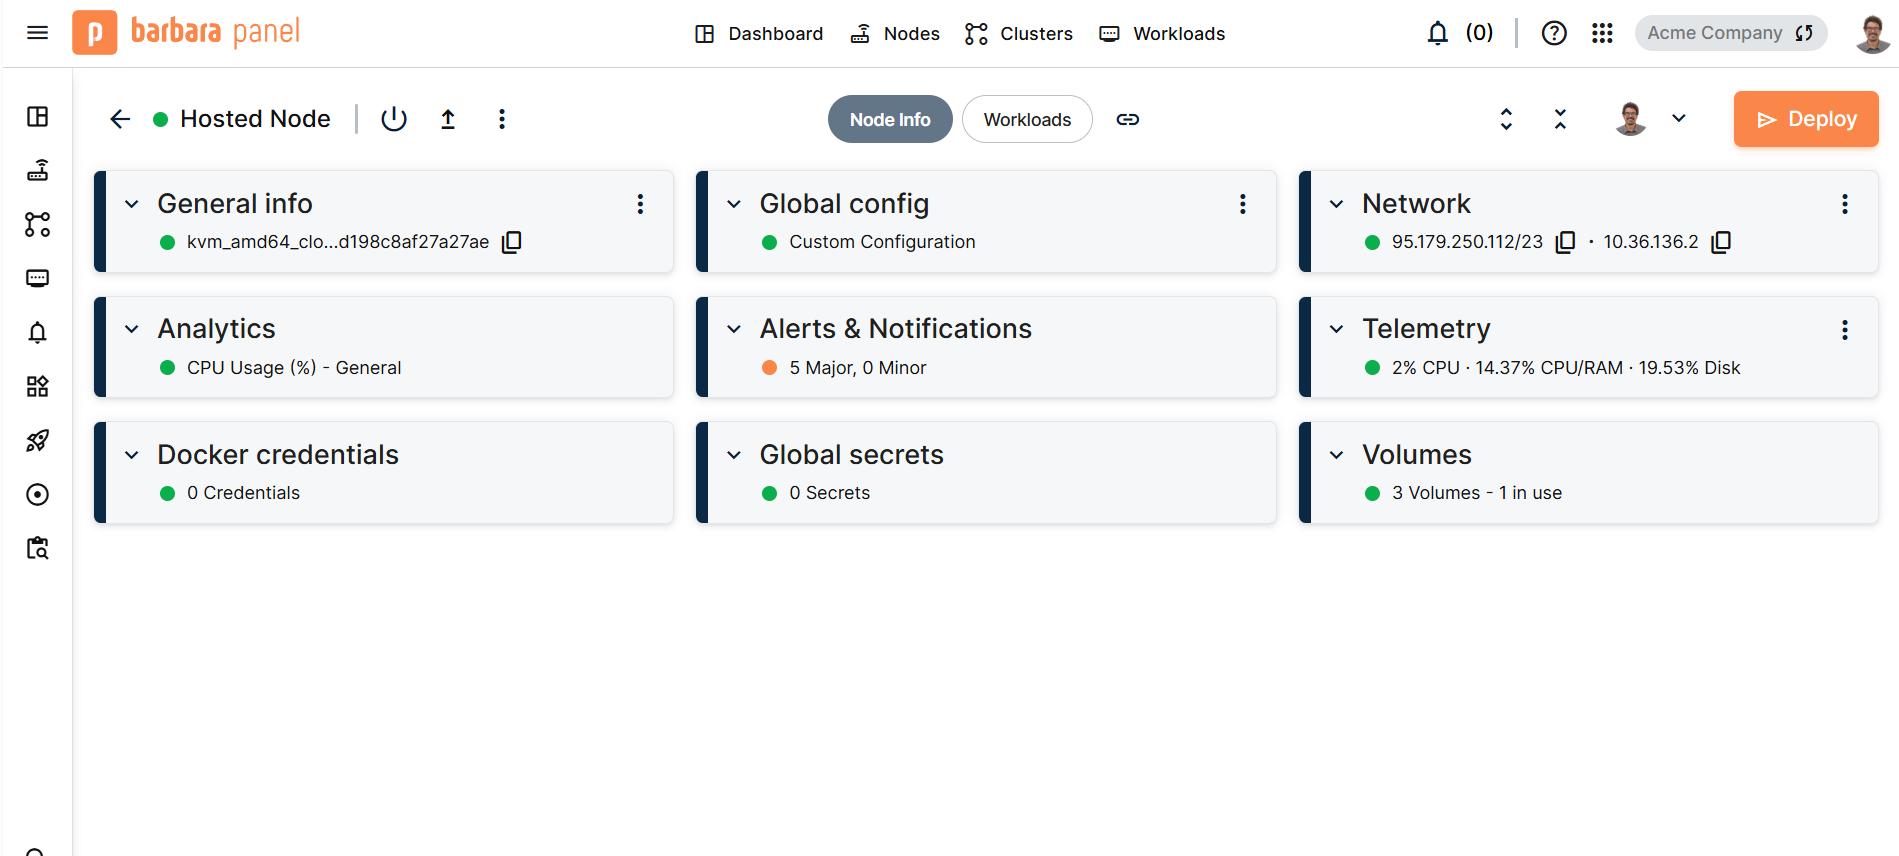
Node Details page — Node Info tab with the card grid and header controls.
The page is divided into three areas:
- Header — the back arrow to the Nodes list, the node name and connectivity status (green dot = connected), three action buttons for lifecycle, Docker, and Barbara Core management, the Node Info / Workloads tab switcher, expand/collapse controls, and the Deploy button.
- Tabs — Node Info shows configuration and observability cards; Workloads shows the apps currently deployed and running on the node.
- Log Viewer — a panel pinned to the bottom of the page that provides real-time access to workload logs from either tab.
Header action buttons
The three icon buttons to the right of the node name each open a different management surface.
Power button — Lifecycle management
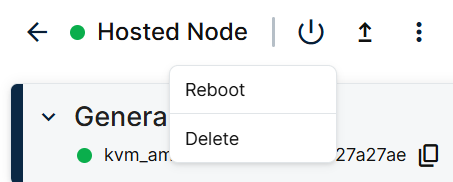
Lifecycle dropdown — Reboot and Delete.
| Action | Effect |
|---|---|
| Reboot | Restarts the edge node. |
| Delete | Removes the node from the Barbara Panel. |
Up-arrow button — Docker management
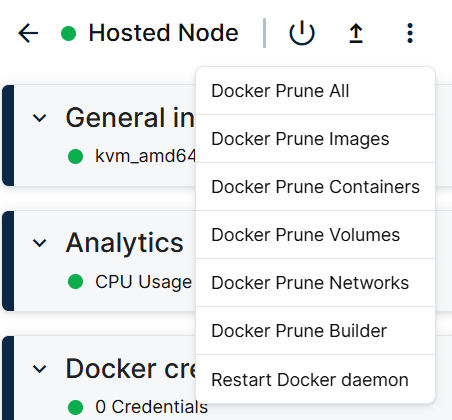
Docker management dropdown.
| Action | Effect |
|---|---|
| Docker Prune All | Runs all prune operations in sequence. |
| Docker Prune Images | Removes unused Docker images. |
| Docker Prune Containers | Removes stopped containers. |
| Docker Prune Volumes | Removes unused volumes. |
| Docker Prune Networks | Removes unused networks. |
| Docker Prune Builder | Clears the BuildKit cache. |
| Restart Docker daemon | Restarts the Docker engine on the node. |
Three-dots button — Barbara Core update
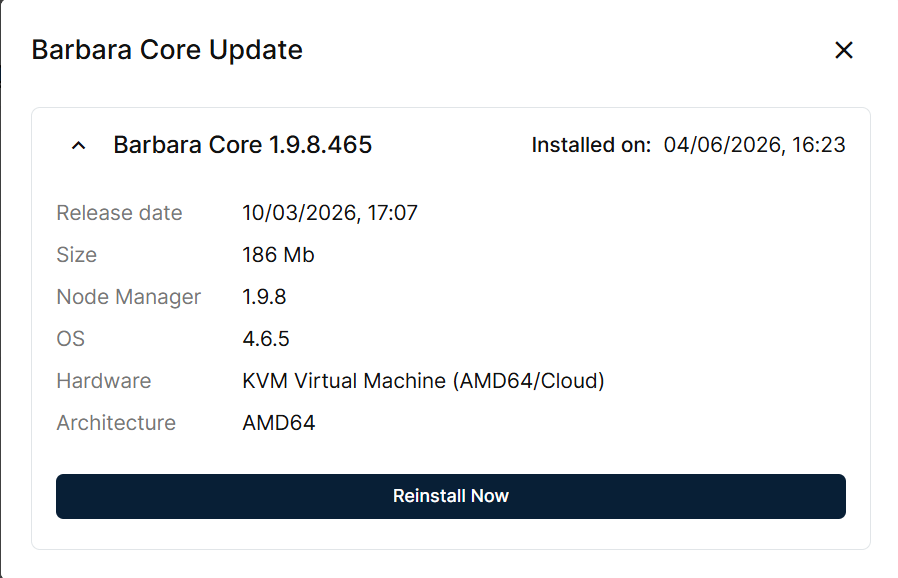
Barbara Core Update modal — installed version details and reinstall option.
The Barbara Core Update modal shows the version currently installed on the node (release date, size, Node Manager version, OS, hardware, and architecture) and provides a Reinstall Now button. See Barbara Core Updates for the full update workflow.
Node Info tab
Cards
The Node Info tab displays a grid of cards. Each card encapsulates a specific concern and shows a live summary line in its collapsed header.
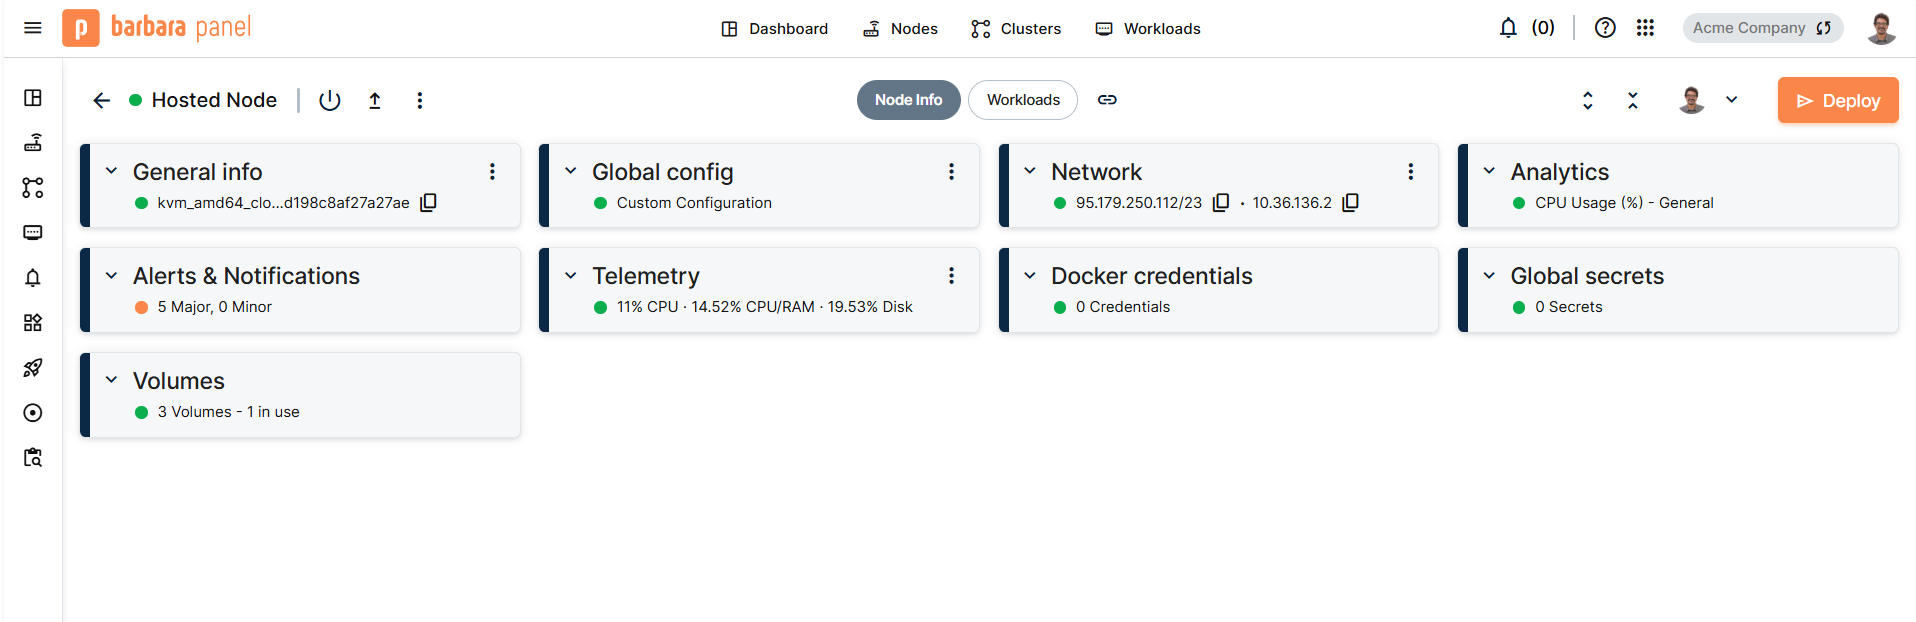
All cards collapsed — the summary line in each header gives a quick status at a glance.
| Card | Summary shown | Details |
|---|---|---|
| General info | Node ID | Identity, location, group, tags, and Node Assets. See General Info. |
| Global config | Configuration name | Runtime configuration shared across all apps on this node. See Global Config. |
| Network | IP address(es) | Network interfaces, addresses, and routing. See Network. |
| Analytics | Active chart name | Historical charts for CPU, memory, disk, and other metrics. See Analytics. |
| Alerts & Notifications | Active alert count | Your alerts for this node, split into Active and Past tabs. See Alert events and delivery. |
| Telemetry | CPU / RAM / Disk % | Latest telemetry sample received. See Telemetry. |
| Docker credentials | Credential count | Credentials used to pull images from private registries. See Credentials. |
| Global secrets | Secret count | Secrets shared across all apps on this node. See Secrets. |
| Volumes | Volume count and usage | Docker volumes managed on the node. See Volumes. |
Expanding and collapsing cards
Use the expand (↕) and collapse (×) controls in the top-right of the header bar to expand or collapse all cards at once. Each card can also be toggled individually by clicking its header chevron.
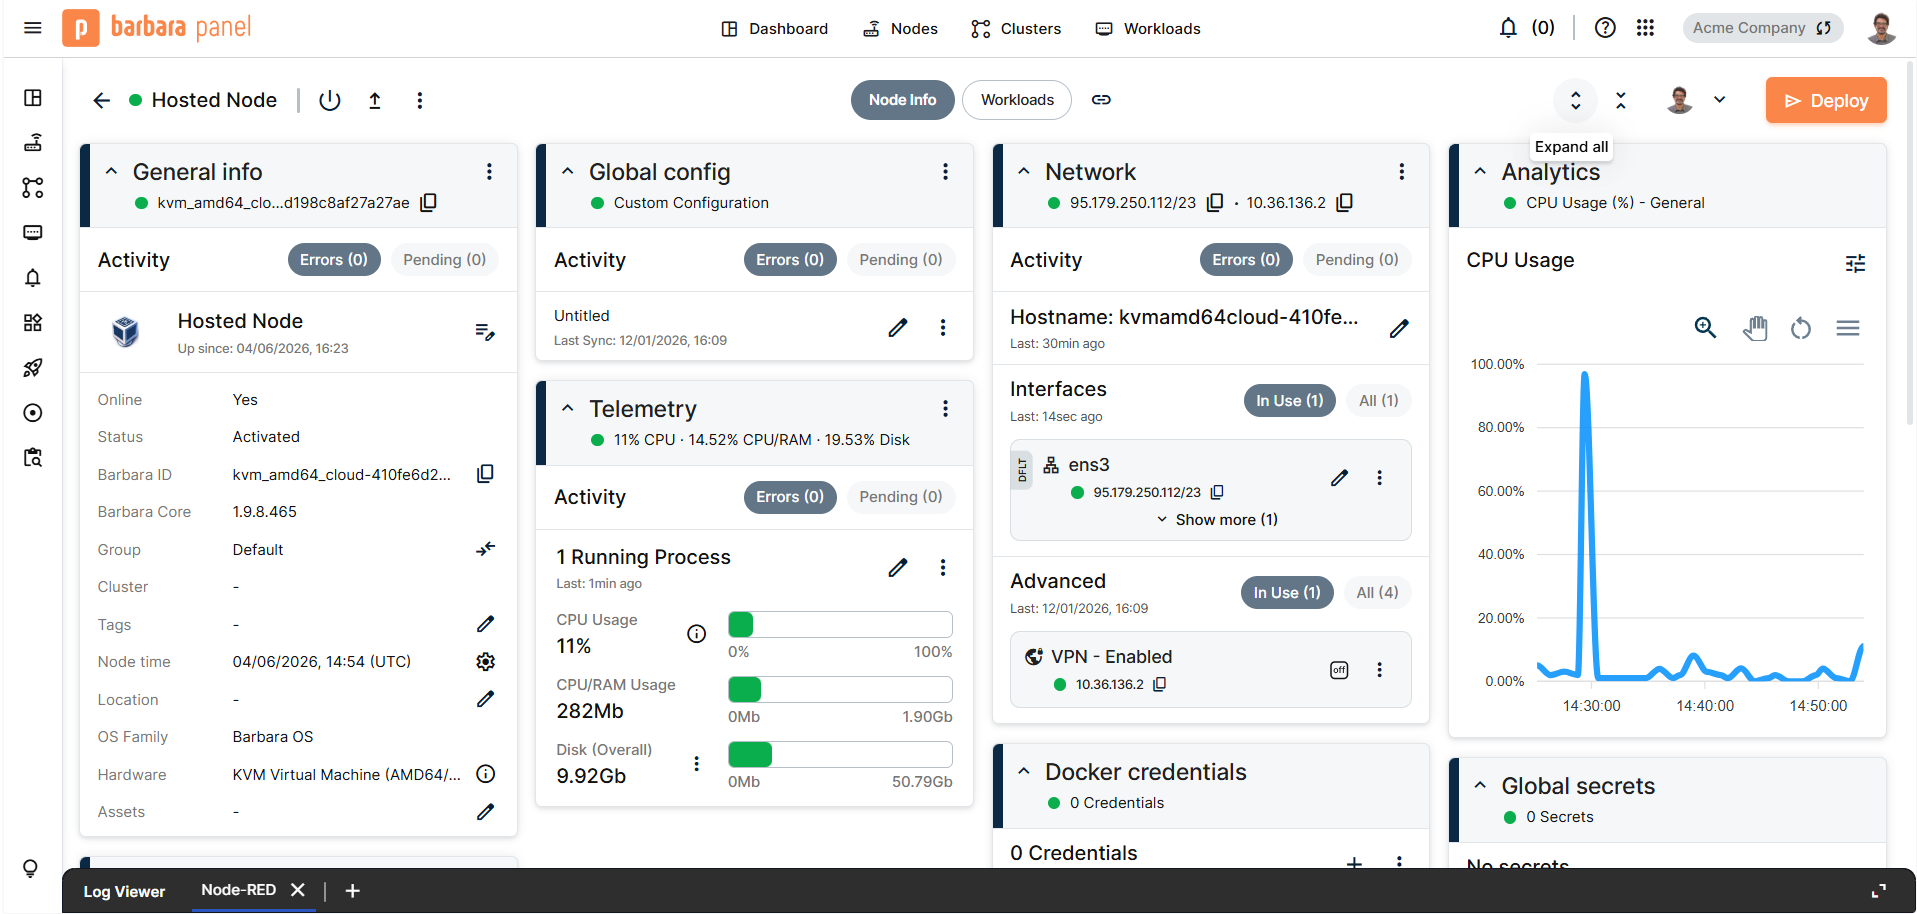
All cards expanded — each card shows its full content and available action controls.
Cards that carry a ⋮ menu offer card-specific actions such as editing configuration or removing the card from the view.
Workloads tab
The Workloads tab lists the apps currently deployed on the node. Each workload card shows the app name, version, and a colour-coded status dot (green = running).
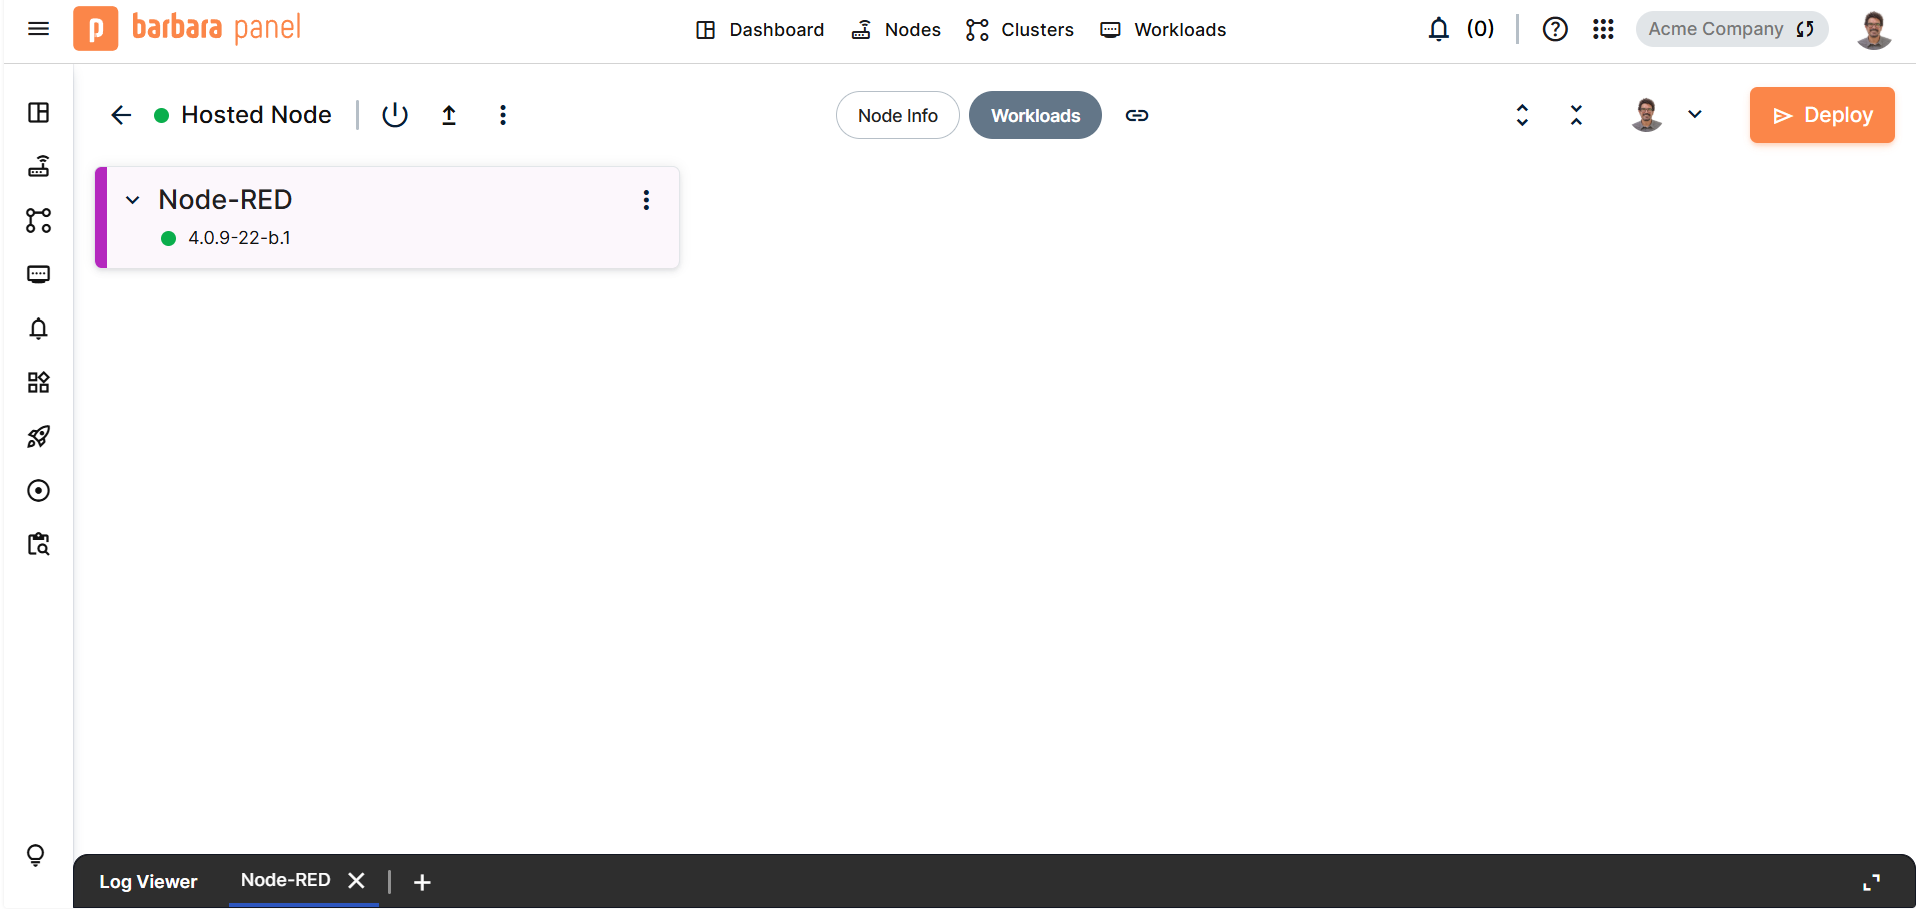
Workloads tab — collapsed workload card and the Log Viewer bar at the bottom.
Click the card header chevron to expand it and reveal its full detail:
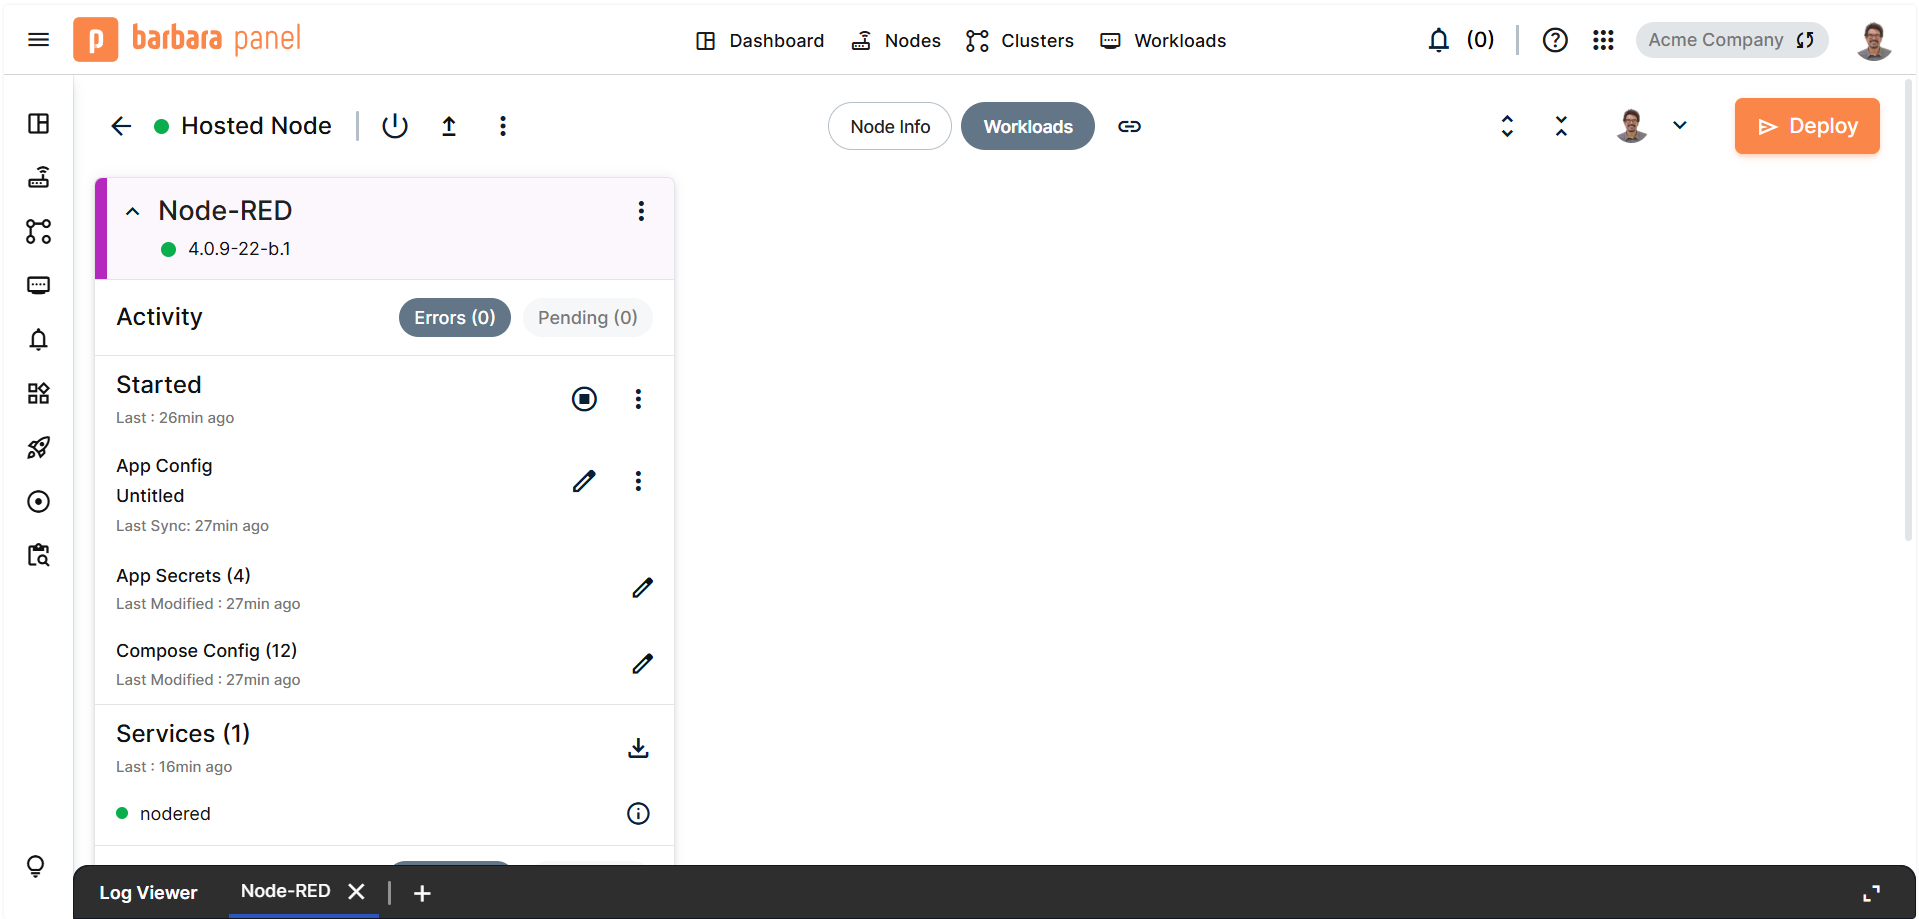
Node-RED workload card expanded — all sections visible.
| Section | Content |
|---|---|
| Activity | Error and pending operation counters for the workload. |
| Started | Time since last start, with a stop button to halt the workload. |
| App Config | The active configuration profile name, with an edit button. |
| App Secrets | Number of secrets configured, with an edit button. |
| Compose Config | Number of Compose configuration entries, with an edit button. |
| Services | The Docker services that make up the workload, each with a status dot and an info button. |
See Docker apps and Marketplace apps for the full set of workload-specific controls.
Log Viewer
The Log Viewer panel is pinned to the bottom of the page and is accessible from both the Node Info and Workloads tabs. Each running workload with active log output appears as a named tab in the panel. Click a tab to stream its logs live; click × on a tab to close that log stream.
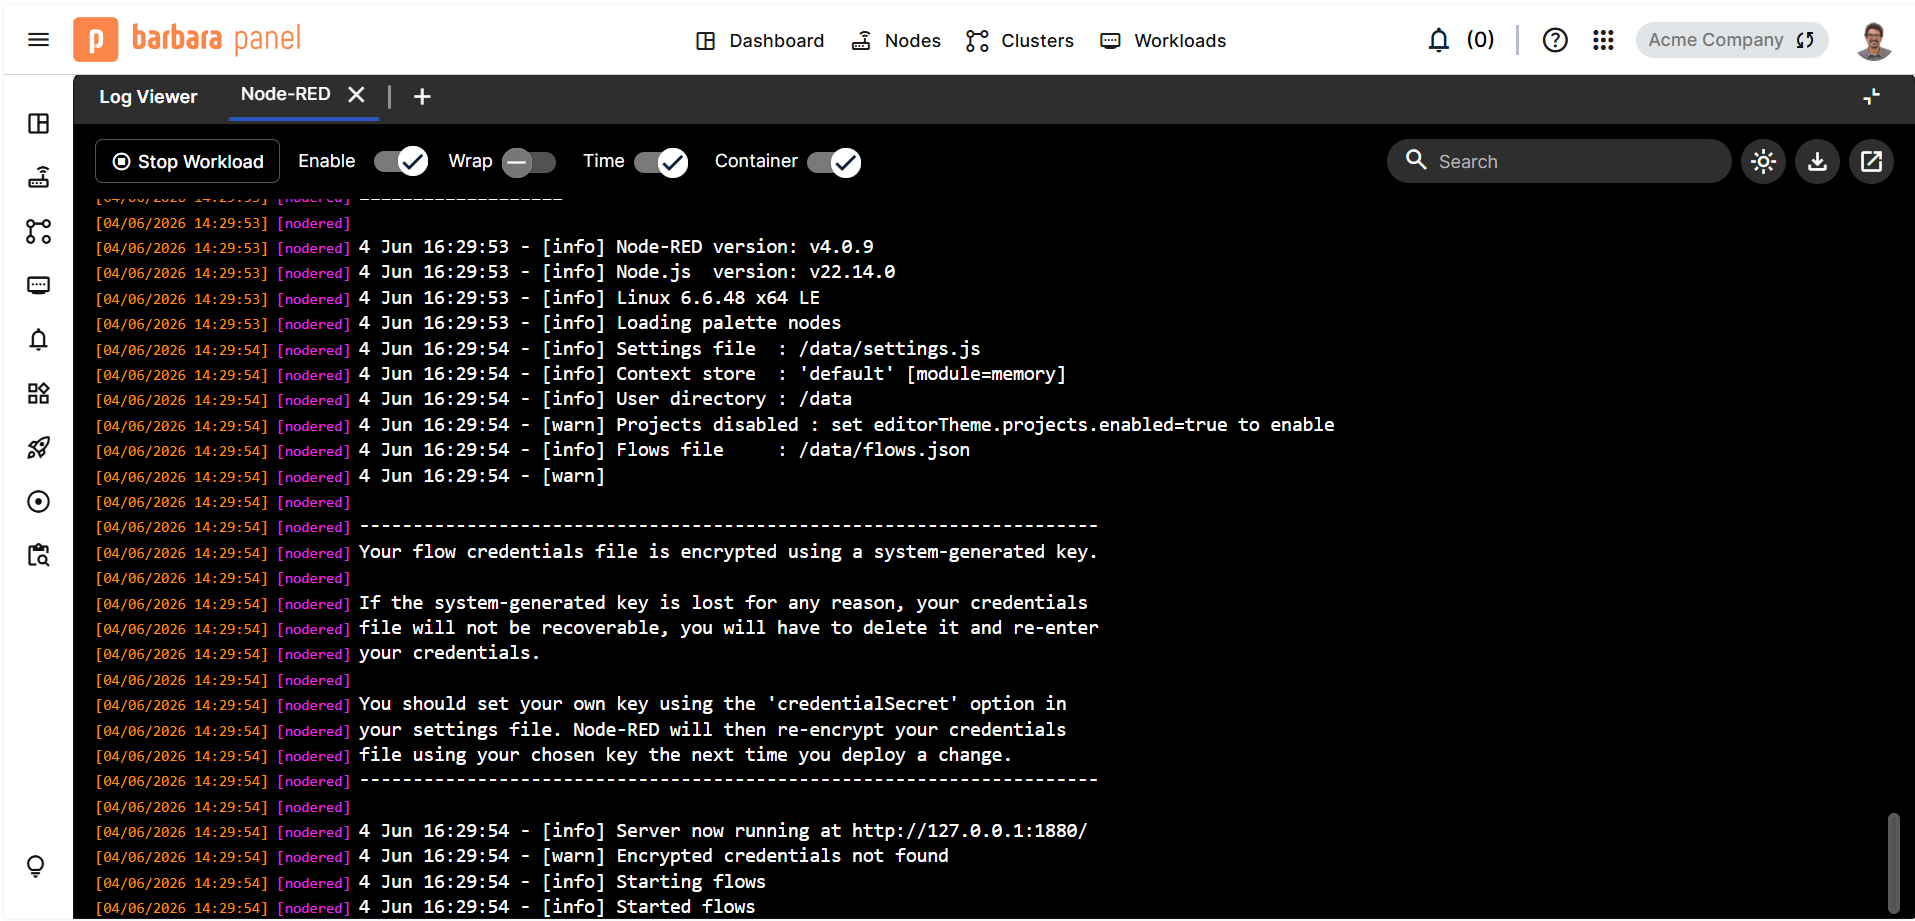
Log Viewer — live Node-RED log stream with its toolbar controls.
The toolbar above the log output provides the following controls:
| Control | Effect |
|---|---|
| Stop Workload | Stops the workload whose logs are currently shown. |
| Enable | Toggles log streaming on or off without closing the panel. |
| Wrap | Wraps long log lines to fit the panel width. |
| Time | Toggles the timestamp prefix on each log line. |
| Container | Filters log output to a specific container within the workload (relevant for multi-container apps). |
| Search | Filters visible log lines by keyword. |
| ⛶ (fullscreen) | Expands the Log Viewer to fill the browser window. |
Summary
The Node Details page centralises everything related to one node: the three header buttons handle lifecycle, Docker, and Barbara Core operations; the Node Info tab exposes configuration and observability through expandable cards; the Workloads tab is where deployed apps are managed and monitored; and the Log Viewer provides persistent access to live logs from any workload.