Telemetry
This article refers to Platform v2.9.0. The current Platform version is v3.3.0.
Overview
The Telemetry card on the Node Details page shows the most recent telemetry sample the node has sent to Barbara Panel. It is the fastest way to spot whether a node is healthy right now: temperature, load, RAM, disk, and the resource usage of every workload running on it.
For the historical evolution of the same metrics over a time range, read Analytics.
Telemetry card
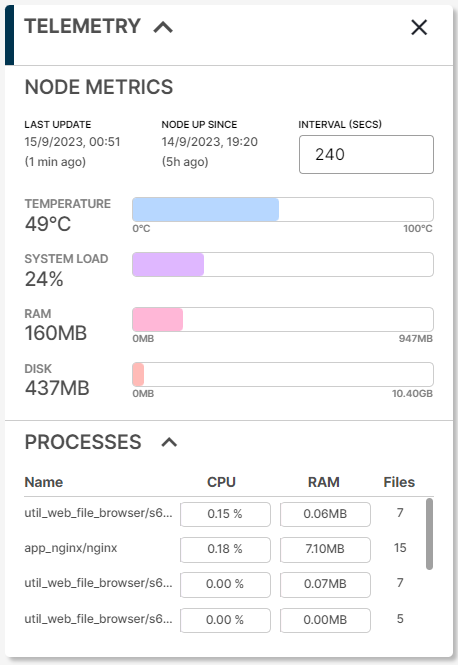
Telemetry card
Node metrics
The top half of the card surfaces metrics about the node itself:
- Last Update — timestamp of the last telemetry sample received.
- Node Up Since — timestamp when the node was last powered on.
- Interval — telemetry interval in seconds; editable in place to change how often the node reports.
- Temperature — CPU temperature of the node.
- System Load — average number of processes in the run queue. A high value indicates the node is overloaded.
- RAM — RAM used by the node (system + workloads) vs total available.
- Disk — disk used vs total available.
A high system load typically comes from one of:
- Too many concurrent processes.
- A single process consuming more CPU than the node can serve.
- A CPU that is too slow for the workload mix.
To bring the load down, reduce the number of running workloads, optimise the resource usage of the heaviest ones, or move to more capable hardware.
Process metrics
The bottom half lists the workloads running on the node and, for each, three per-process metrics:
- CPU — percentage of CPU used by the process.
- RAM — RAM used by the process.
- Files — number of open files held by the process.
This section only contains data when at least one workload is deployed on the node.
Summary
Use the Telemetry card as your at-a-glance health check for a node and its workloads. When you need a longer view — trends, regressions, comparisons over time — switch to the Analytics card.