Nodes List
This article refers to Platform v3.2.0. The current Platform version is v3.3.0.
Overview
The Nodes List is the central management surface for all edge nodes registered in Barbara Panel. It provides a real-time inventory of every node along with its connectivity state, lifecycle status, resource utilization, and network addressing. From this view you can search and filter the fleet, switch to a geographic Map view, and dispatch batch operations to multiple nodes simultaneously through the Batch Command Manager.
Nodes List view
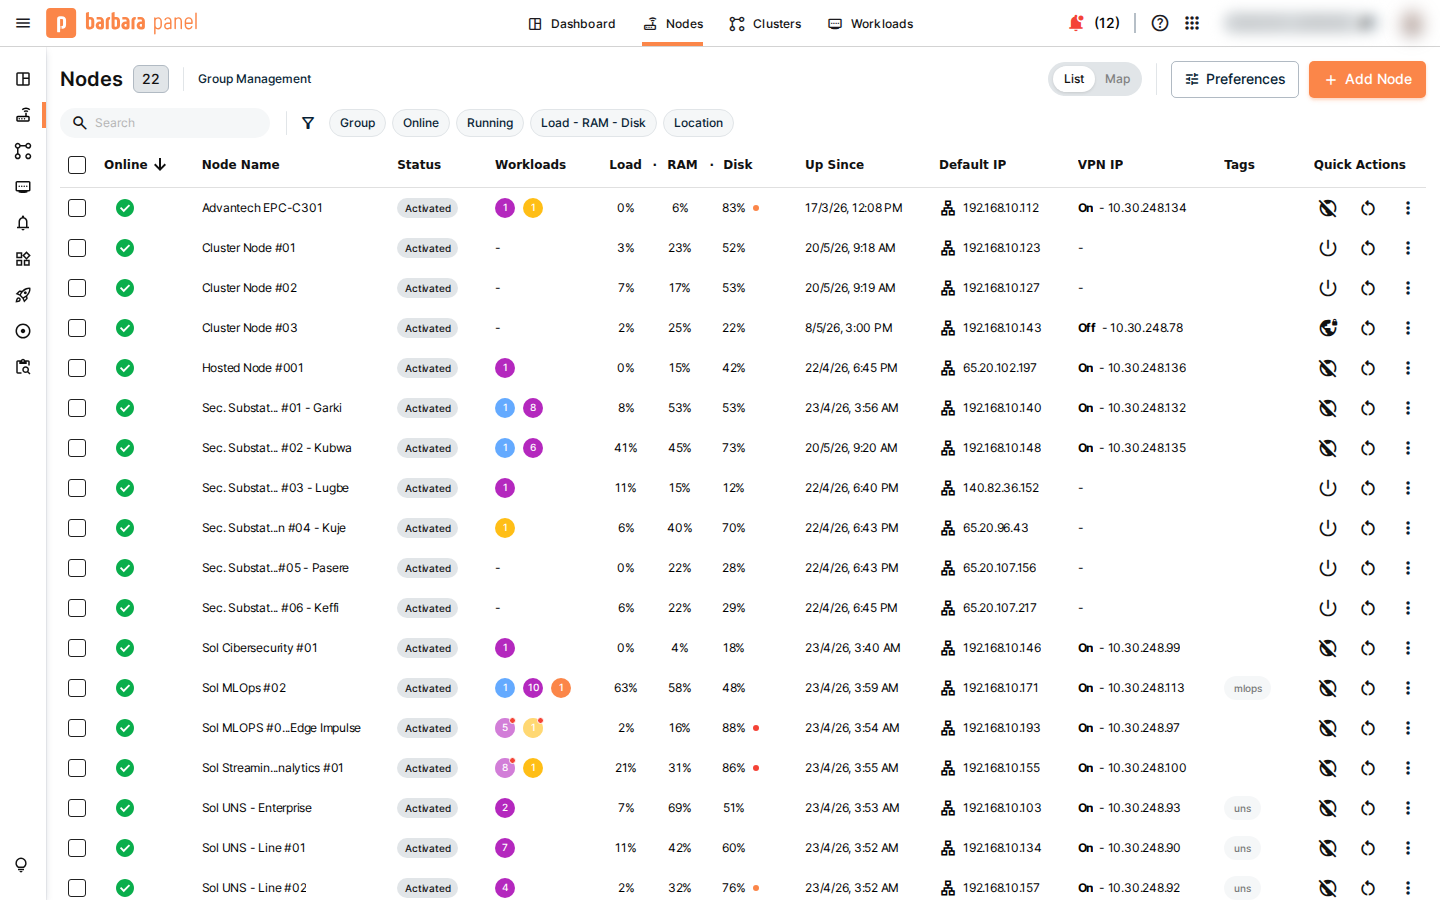
Nodes List — list view
The page header shows the total count of registered nodes (e.g., Nodes 22) and a Group Management shortcut. The controls row above the table provides:
- List / Map — switches between the tabular list and the geographic map.
- Preferences — configures which columns are visible in the table.
- + Add Node — opens the node registration dropdown (see Register a node).
Filters and search
The filter bar offers five independent filters that can be combined:
| Filter | Description |
|---|---|
| Search | Free-text filter by node name. |
| Group | Restricts the list to nodes belonging to a specific group. |
| Online | Shows only currently connected nodes. |
| Running | Shows only nodes with at least one running workload. |
| Load – RAM – Disk | Filters by resource utilization thresholds. |
| Location | Filters by the geographic location assigned to each node. |
Table columns
Each row represents one edge node and exposes the following fields:
| Column | Description |
|---|---|
| (checkbox) | Selects the node for a batch operation. |
| Online | Green indicator when the node is connected; red when offline. |
| Node Name | The display name assigned to the node. |
| Status | Lifecycle status (e.g., Activated). See Node Management for the full state machine. |
| Workloads | Count of deployed workloads and their running state. |
| Load · RAM · Disk | Current CPU load, RAM usage, and disk usage, each expressed as a percentage. |
| Up Since | Timestamp of the last successful connection establishment. |
| Default IP | Primary network interface IP address. |
| VPN IP | VPN tunnel IP address assigned by the Barbara VPN service. |
| Tags | Labels attached to the node for classification and filtering. |
| Quick Actions | Per-node shortcut buttons (power, restart, additional options). |
Register a node
Click + Add Node in the controls row to open the registration dropdown.
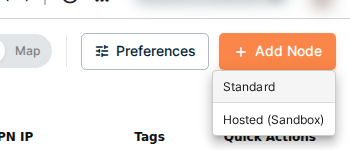
Add Node — registration type selection
Two registration types are available:
- Standard — registers a physical or virtual edge device running the Barbara Agent. Use this for production deployments.
- Hosted (Sandbox) — provisions a cloud-hosted sandbox node managed by Barbara. Use this for evaluation and development without physical hardware.
For the complete registration procedure, see Add the node to Panel.
Map view
The Map view plots each node as a marker on a geographic map, positioned at the coordinates configured in the node's General Info card. A collapsible side panel lists all nodes with their current status, IP addresses, and a direct link to the node detail page.
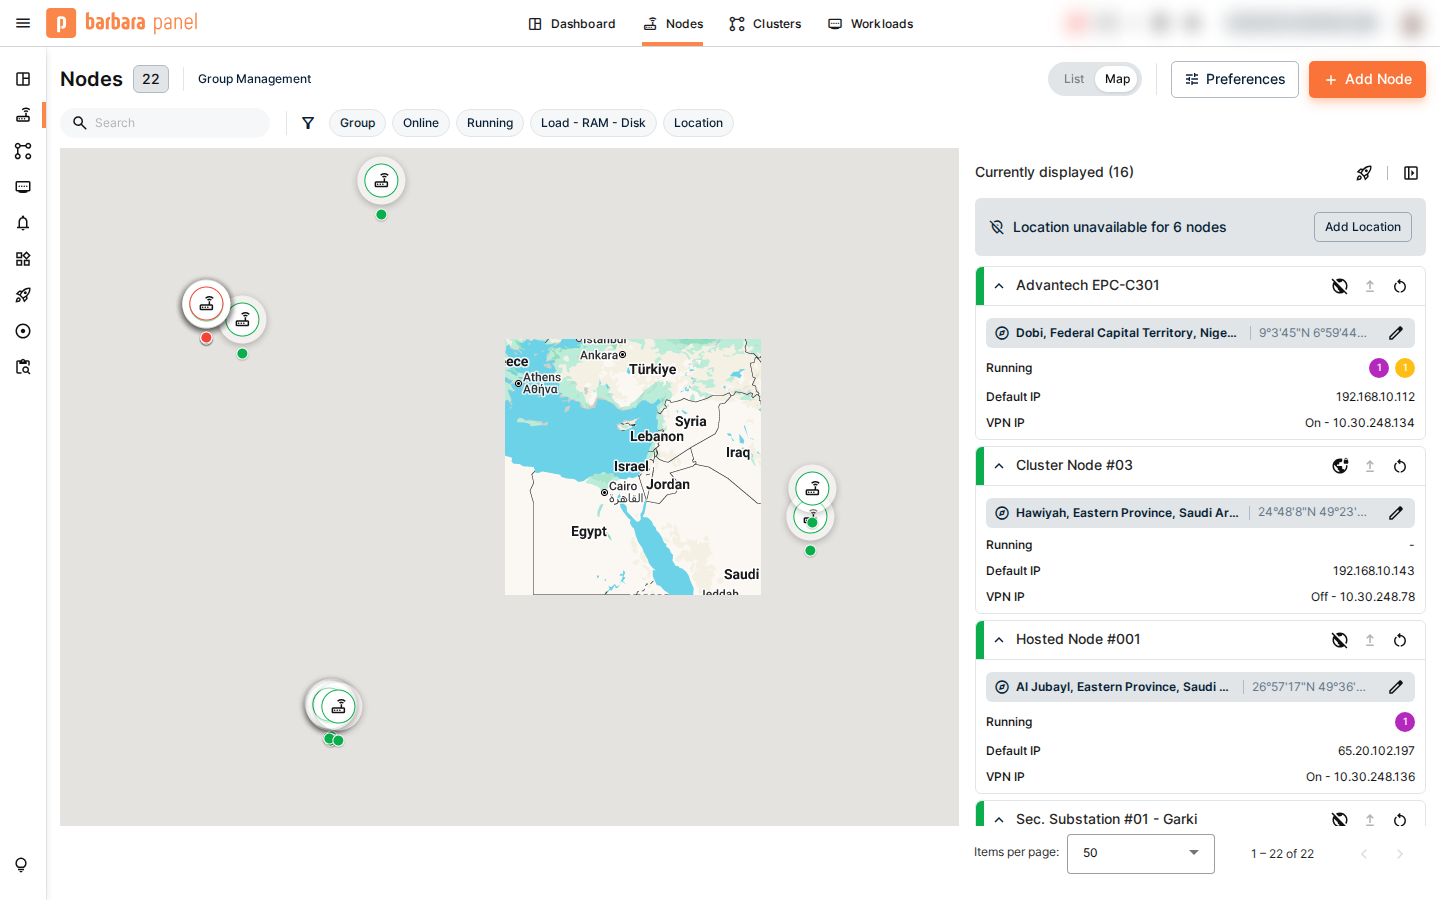
Map view — node locations and detail side panel
Nodes without configured coordinates appear in a Location unavailable group at the top of the side panel. Click Add Location to assign coordinates to those nodes directly from the map view.
Launch a batch operation
Batch operations let you apply the same command to multiple nodes in a single guided workflow — the Batch Command Manager.
1) Select target nodes
Tick the checkboxes next to the nodes you want to target, or use the header checkbox to select all nodes visible in the current filtered view. A batch toolbar appears above the table confirming the selection count.
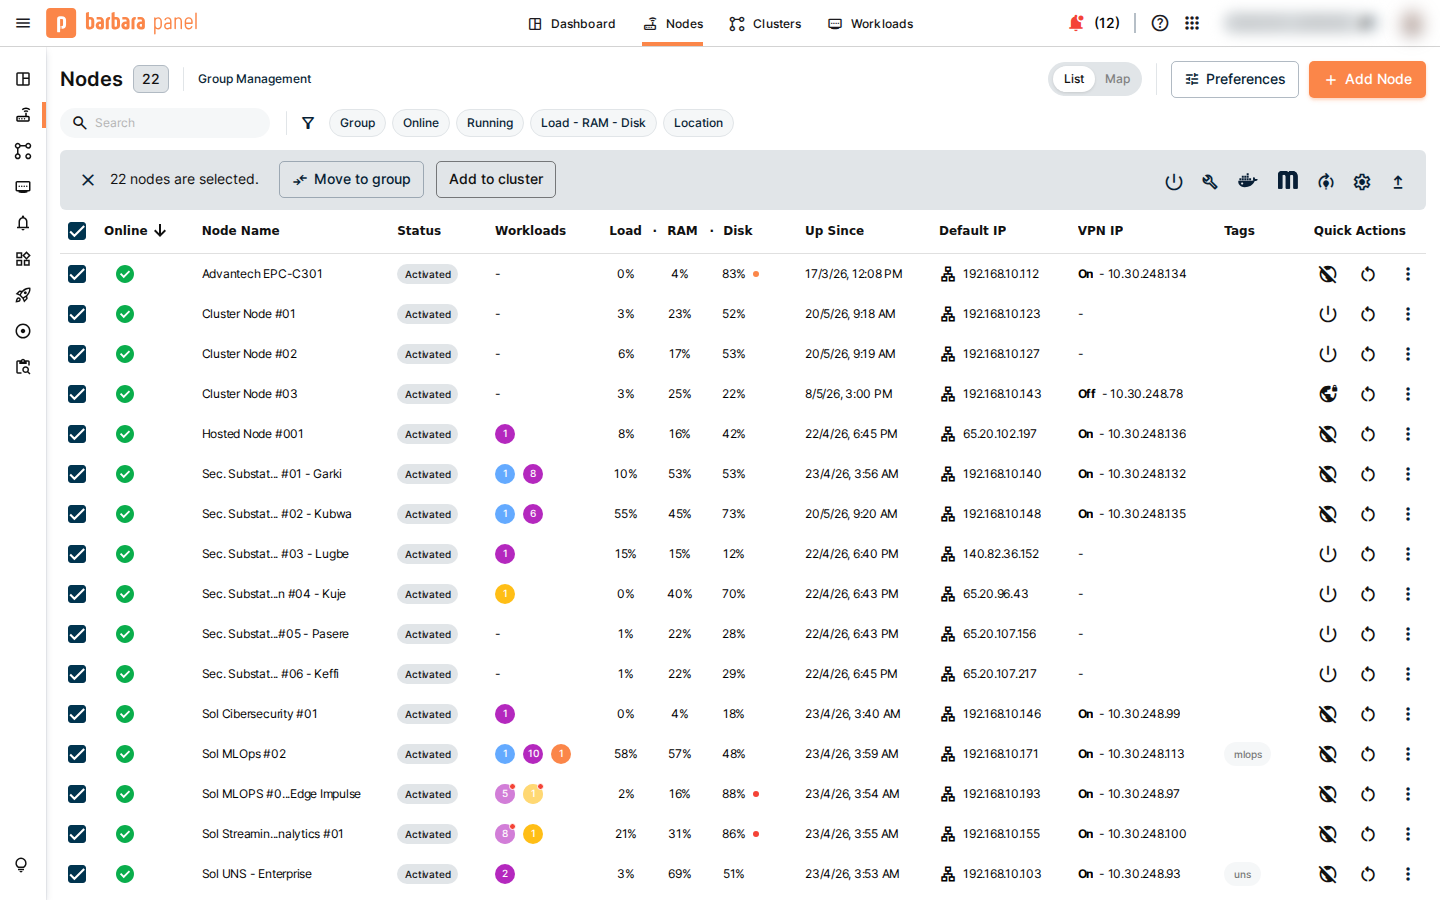
Batch toolbar — selected node count and action shortcuts
From the batch toolbar you can also Move to group or Add to cluster in a single click. For more granular operations, click any of the batch action icons to open the Batch Command Manager.
2) Choose a command
The Batch Command Manager is a three-step wizard:
- Target Selection — confirms the set of nodes included in the batch.
- Command Selection — lets you pick a command from one of seven category groups.
- Batch Review — presents a full operation summary before execution.
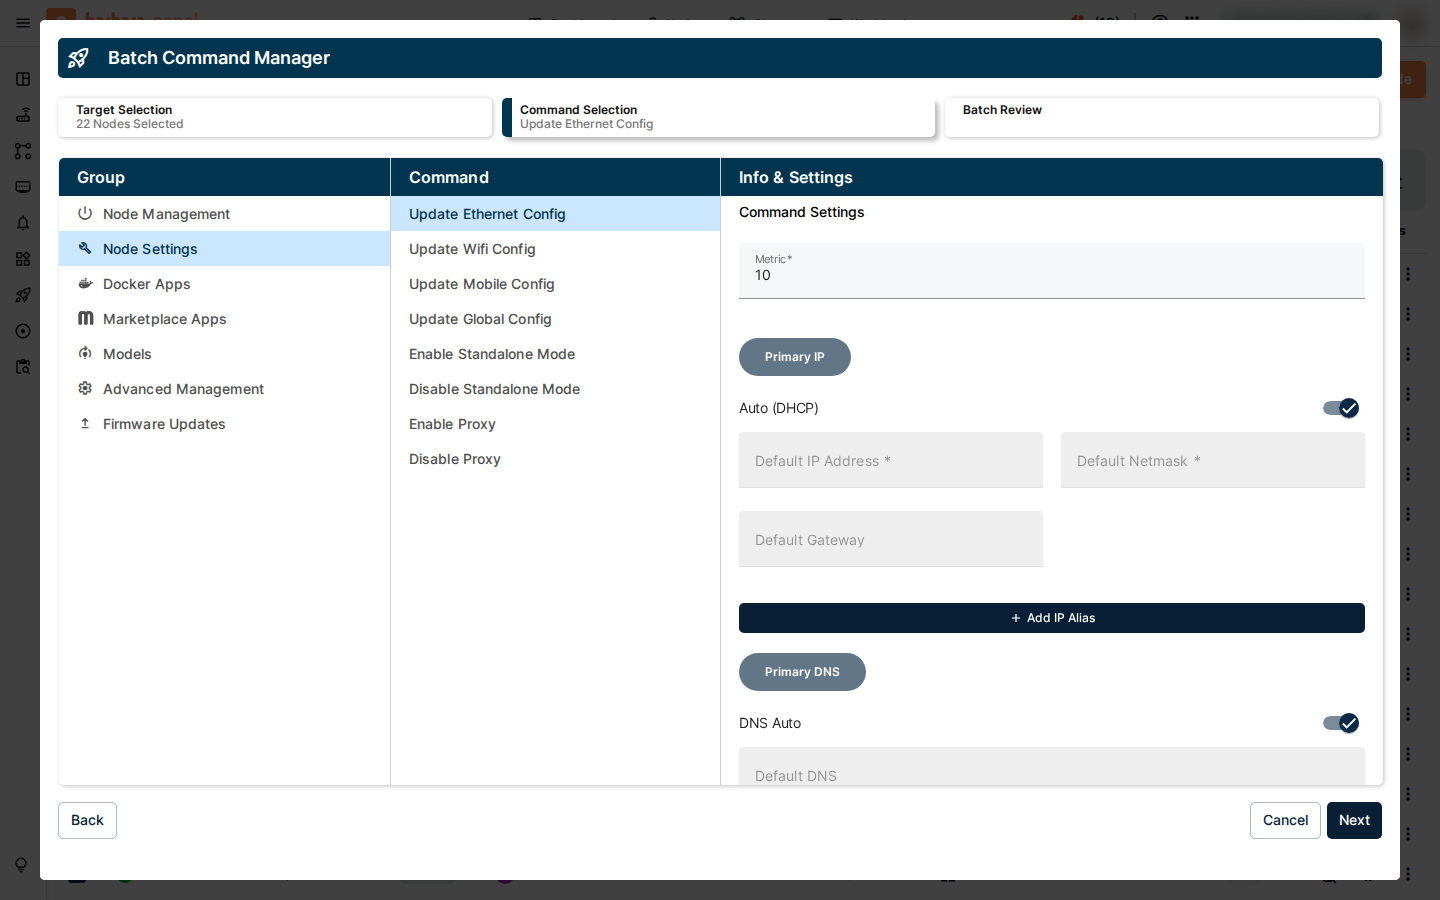
Batch Command Manager — Command Selection step (Node Settings group shown)
The seven command groups available in the Command Selection step are:
| Group | Scope |
|---|---|
| Node Management | Node power state, activation, and lifecycle transitions. |
| Node Settings | Network configuration (Ethernet, Wi-Fi, Mobile, Global Config), proxy settings, and standalone mode. |
| Docker Apps | Deployment and lifecycle management of Docker-based workloads. |
| Marketplace Apps | Installation, update, and removal of Barbara Marketplace applications. |
| Models | Deployment and update of AI/ML model workloads. |
| Advanced Management | Low-level agent and system-level operations. |
| Firmware Updates | Firmware upgrade package delivery to target nodes. |
3) Review and confirm
The Batch Review step displays the full operation summary including target nodes and command parameters. Confirm to dispatch the batch. Progress can be monitored from the Batches view.
For the full reference of batch operations and progress monitoring, read Batches List.
Summary
The Nodes List provides a unified view of your entire node fleet. Use the List view for day-to-day inventory management, the Map view when geographic context matters, and the Batch Command Manager whenever you need to apply consistent changes across multiple nodes in a single operation.