Step 5 — Deploy Grafana
This article refers to Platform v3.0.0. The current Platform version is v3.2.0.
Overview
Grafana is the visualisation layer of the stack. It connects to the InfluxDB bucket that the Ingester is filling with simulator data and renders that data as interactive dashboards.
Add Grafana to your Library


Grafana
Data visualisation platform for building interactive panels and dashboards from time-series data.
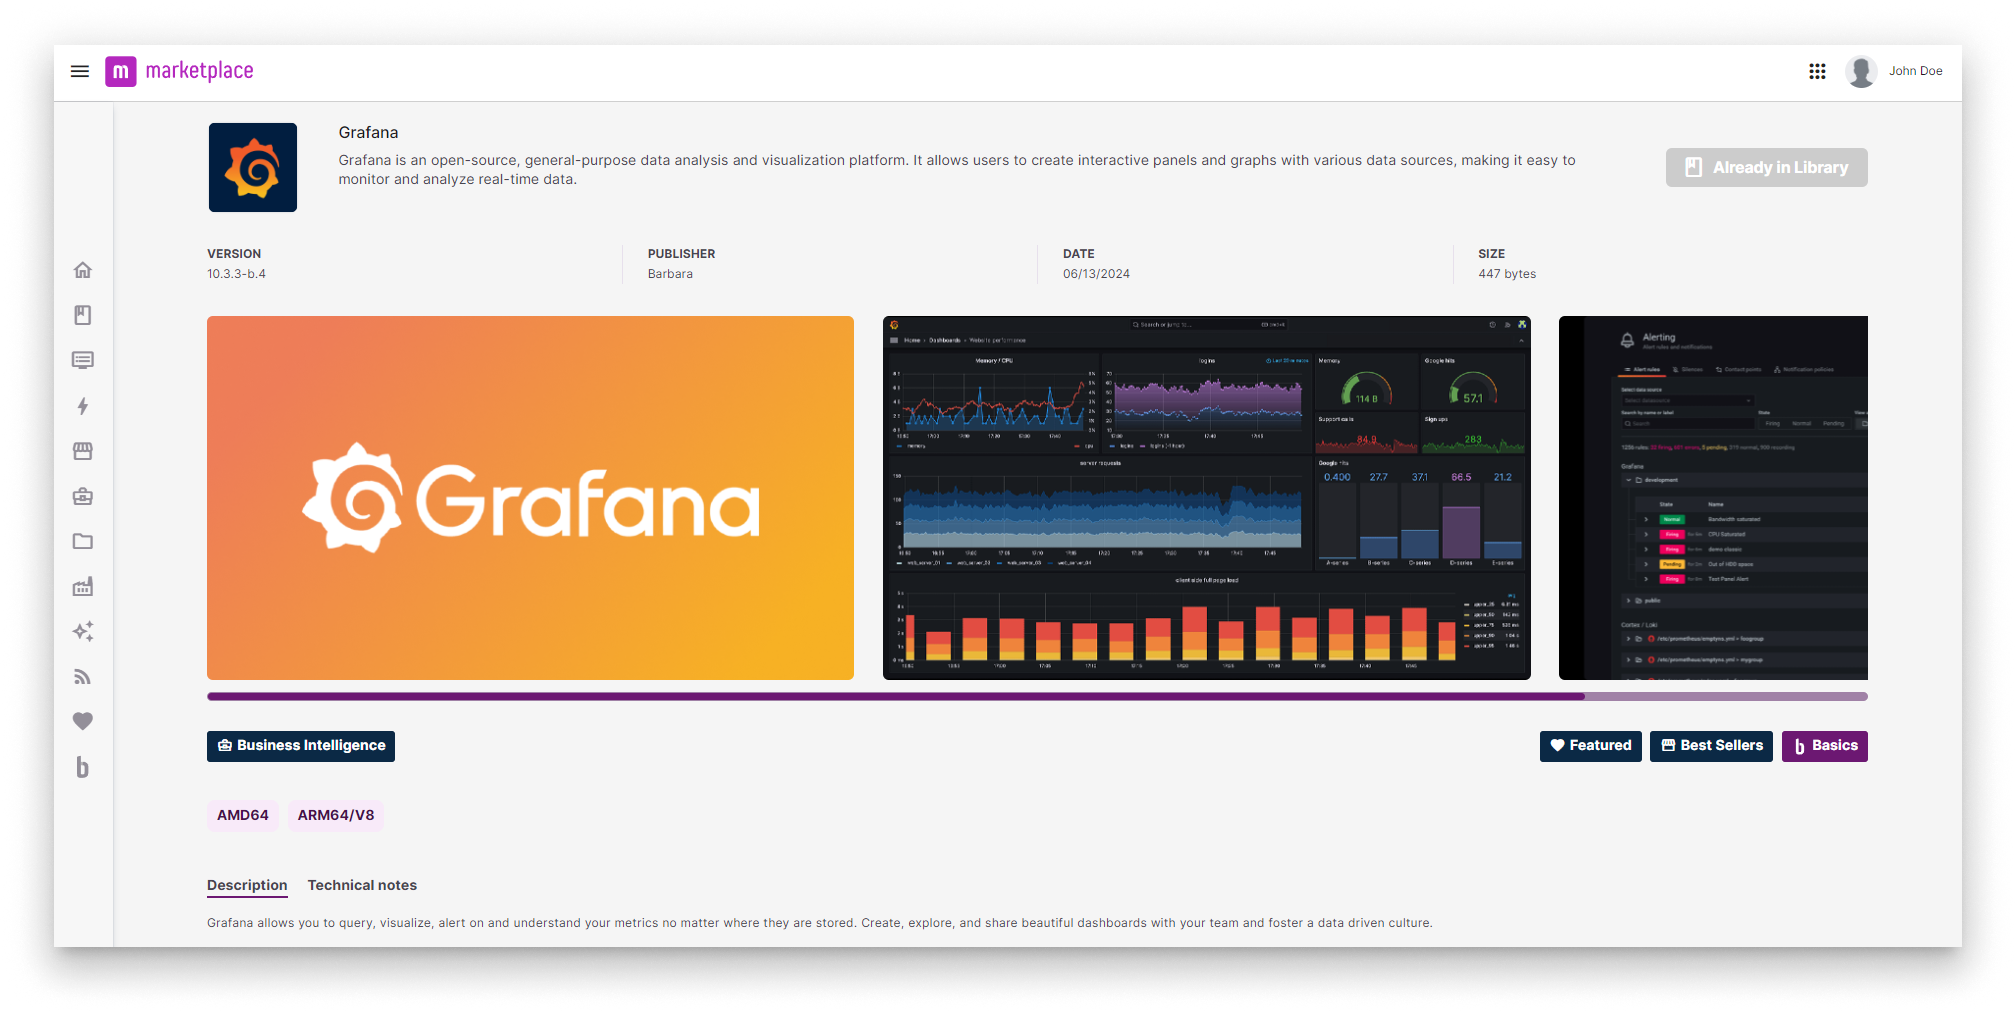
Grafana in the Marketplace
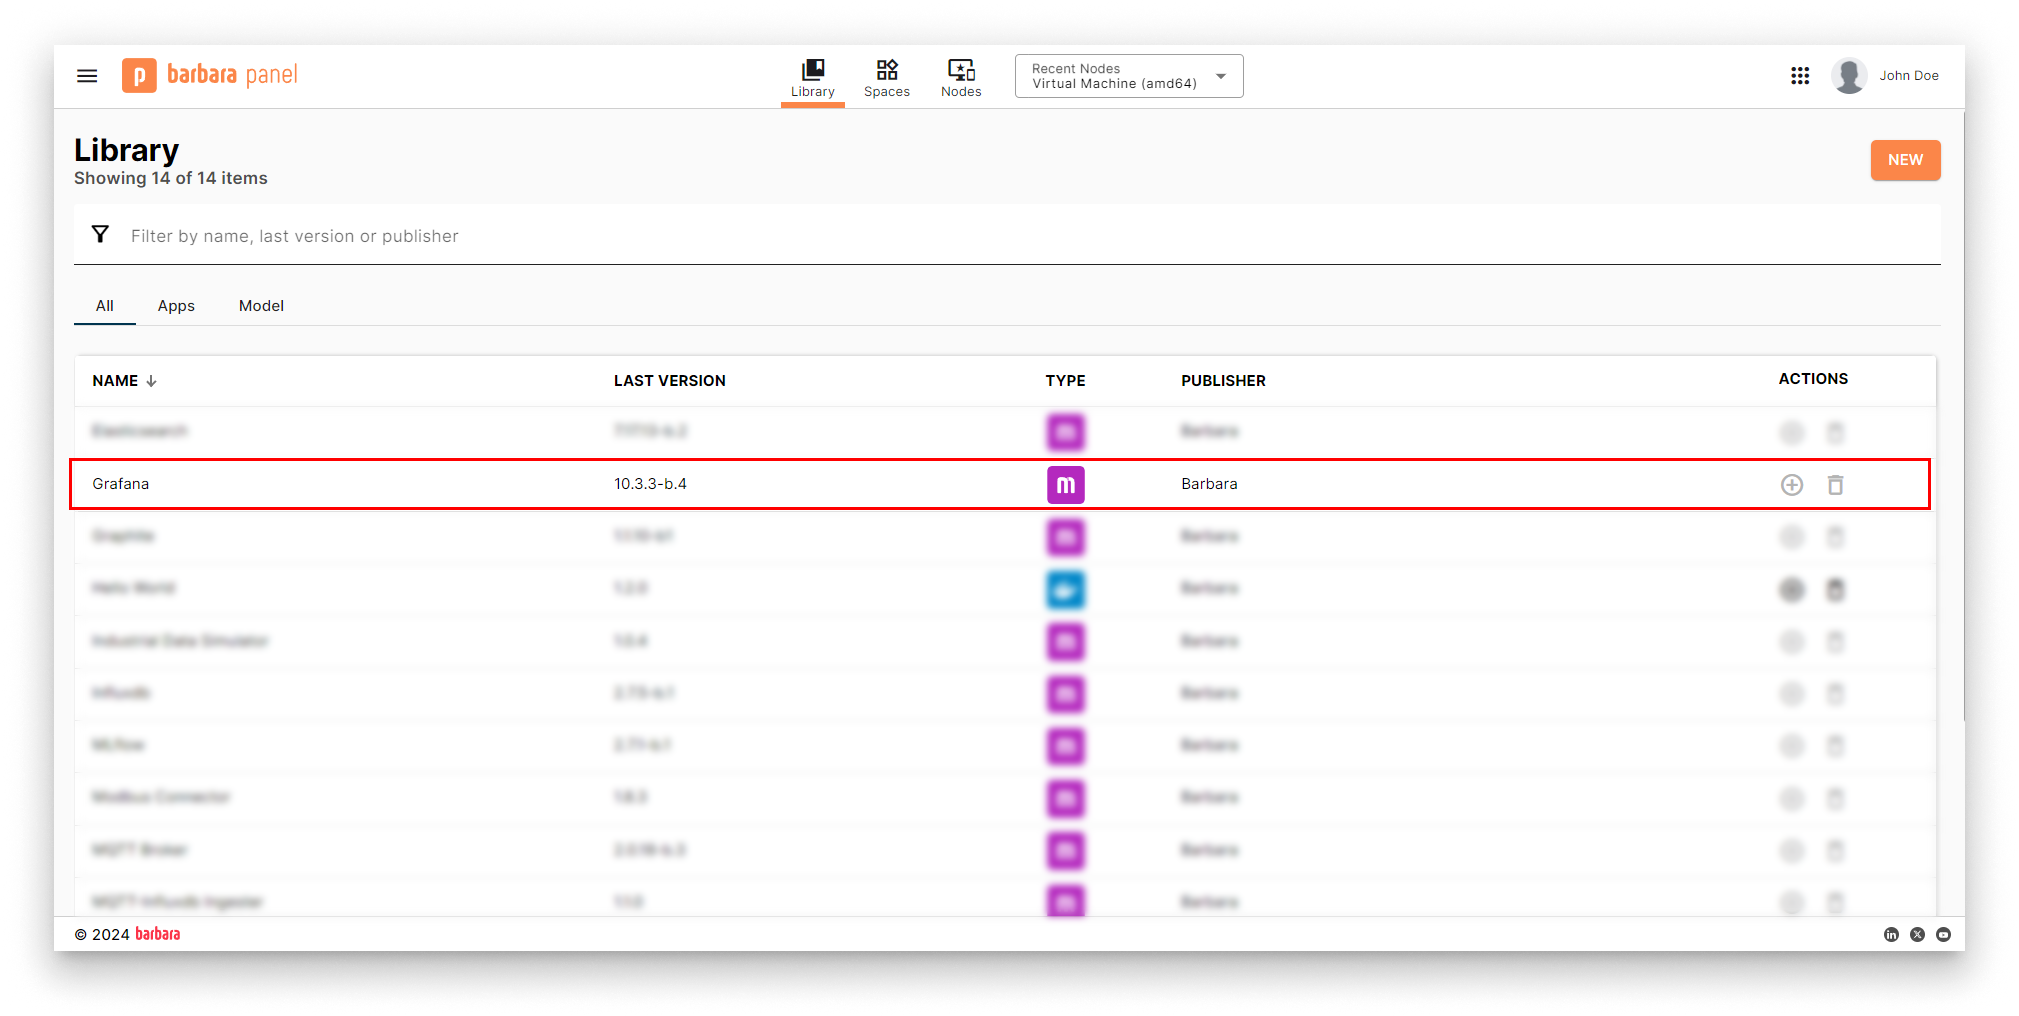
Grafana in the App Library
Deploy Grafana
- Open the Node Details page and click Add card → Marketplace App.
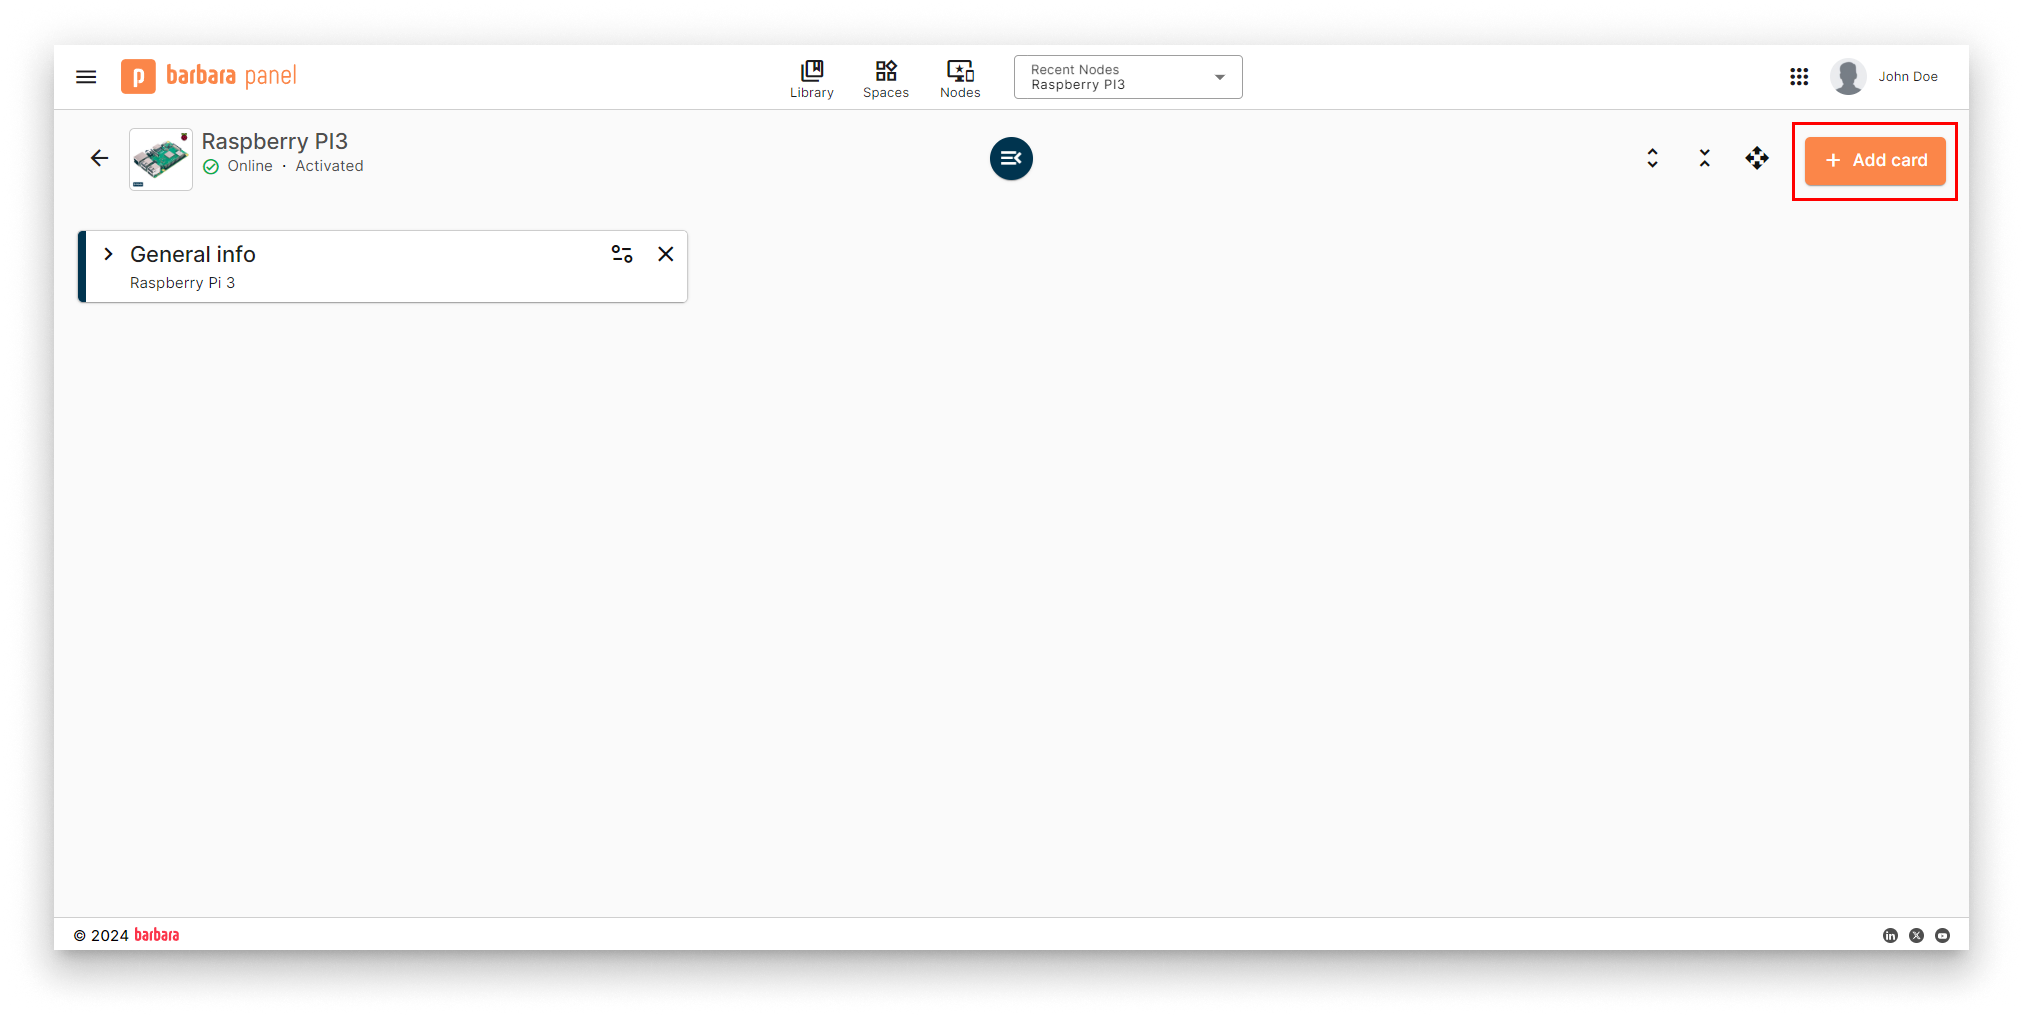
Add card menu
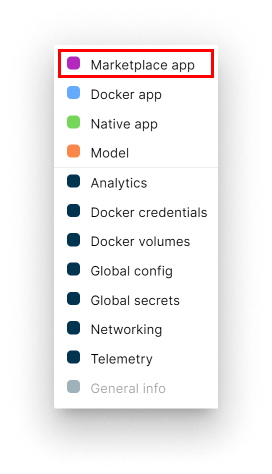
Select Marketplace App
- Select app and version. Pick Grafana and its latest version. Click Next.
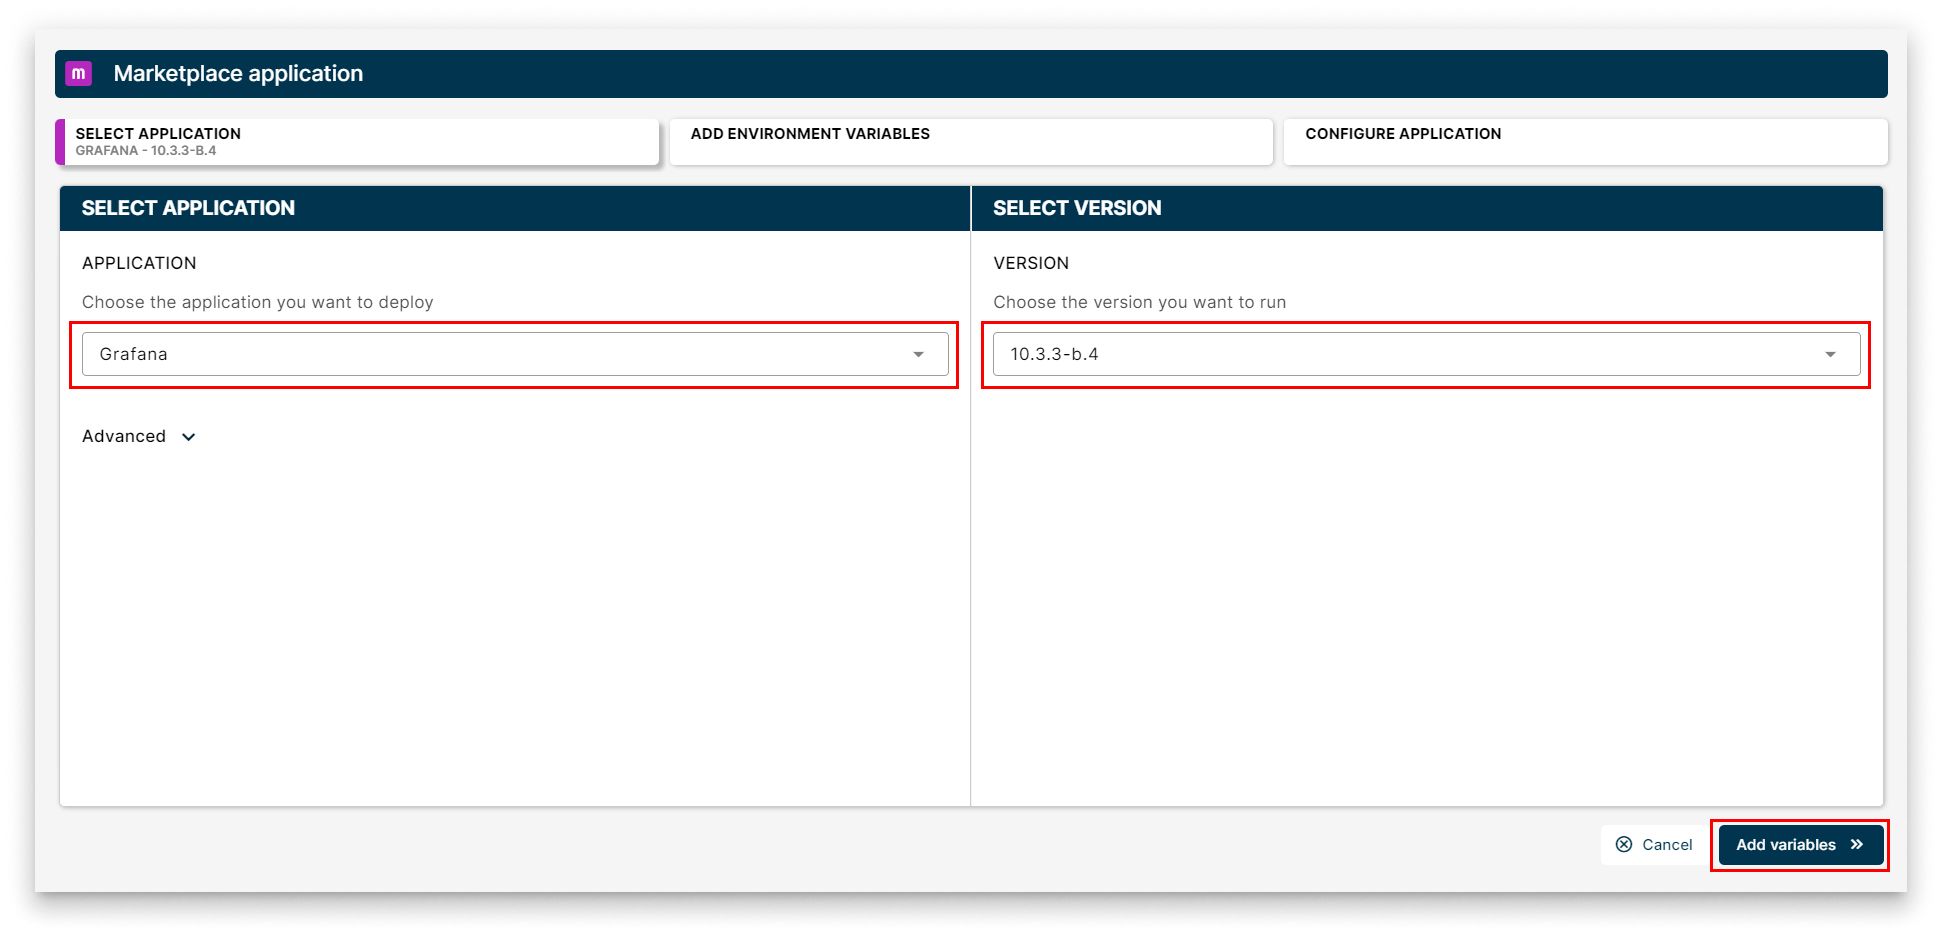
Select Grafana
- App Secrets. Keep the defaults and click Next.
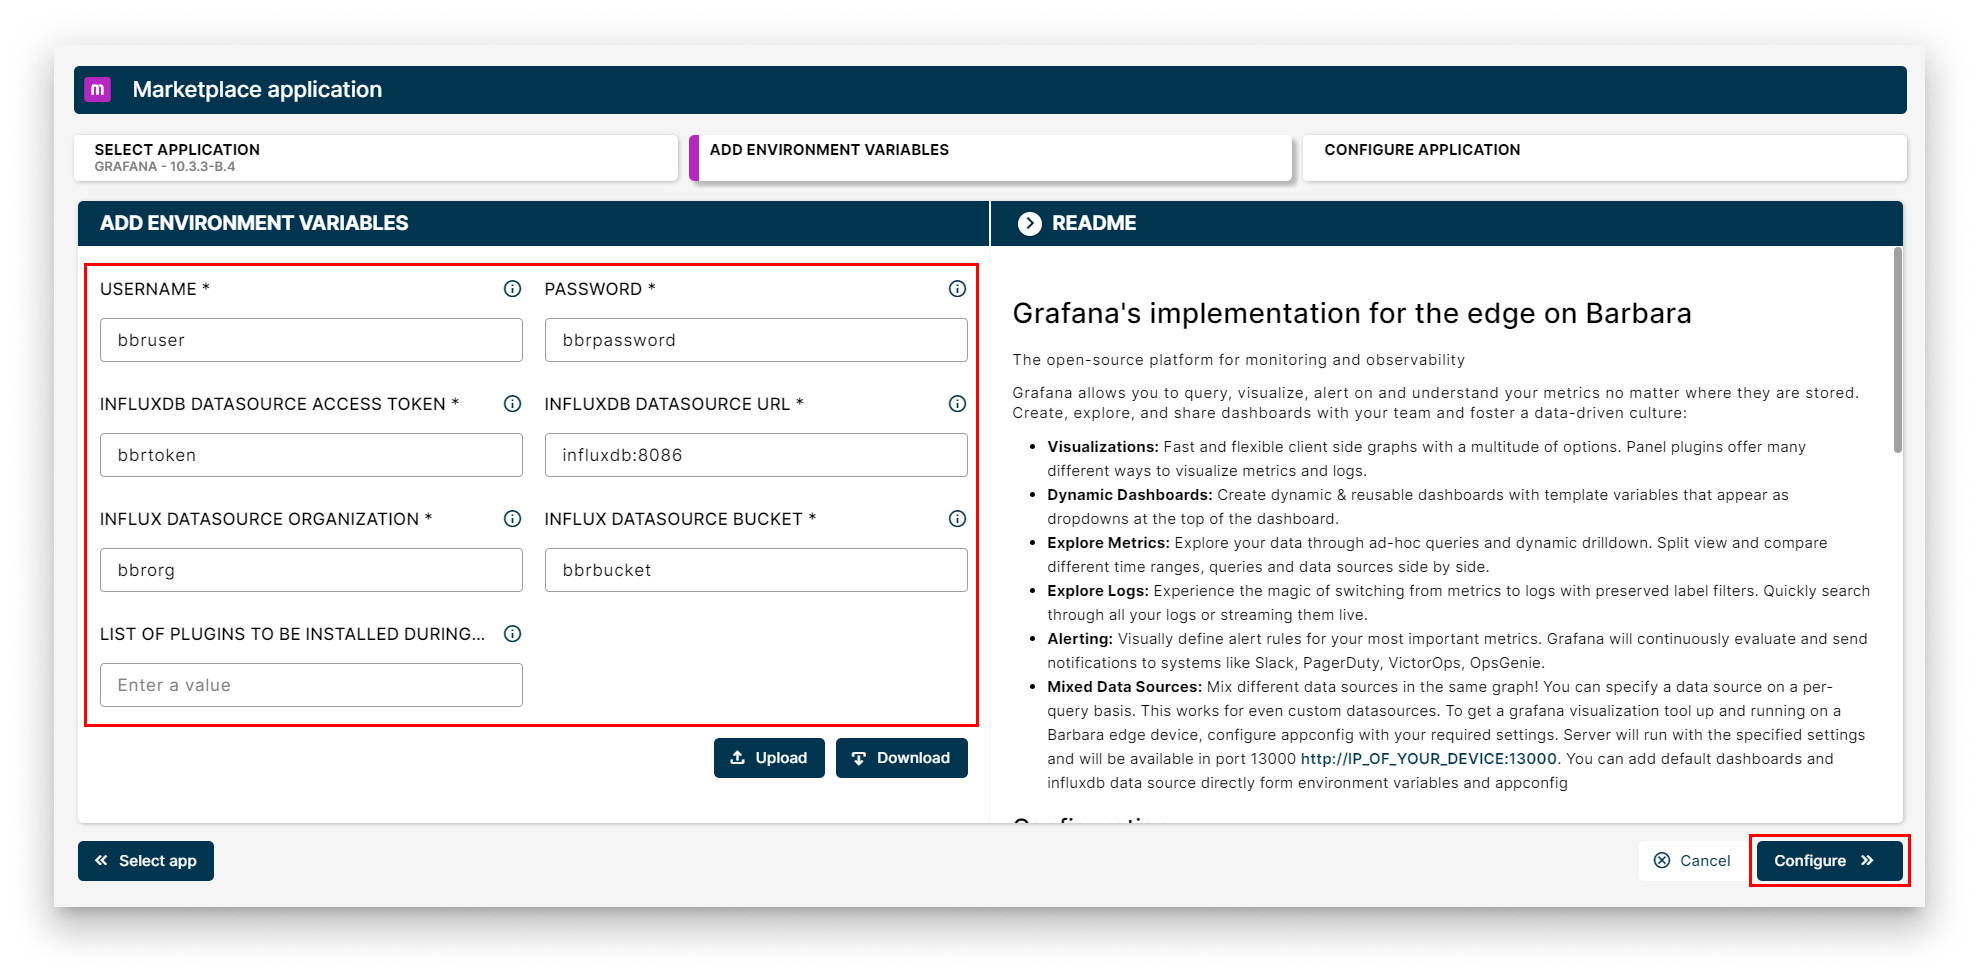
App Secrets for Grafana
- App Config. No extra configuration is required for a default deployment. Click Send App.
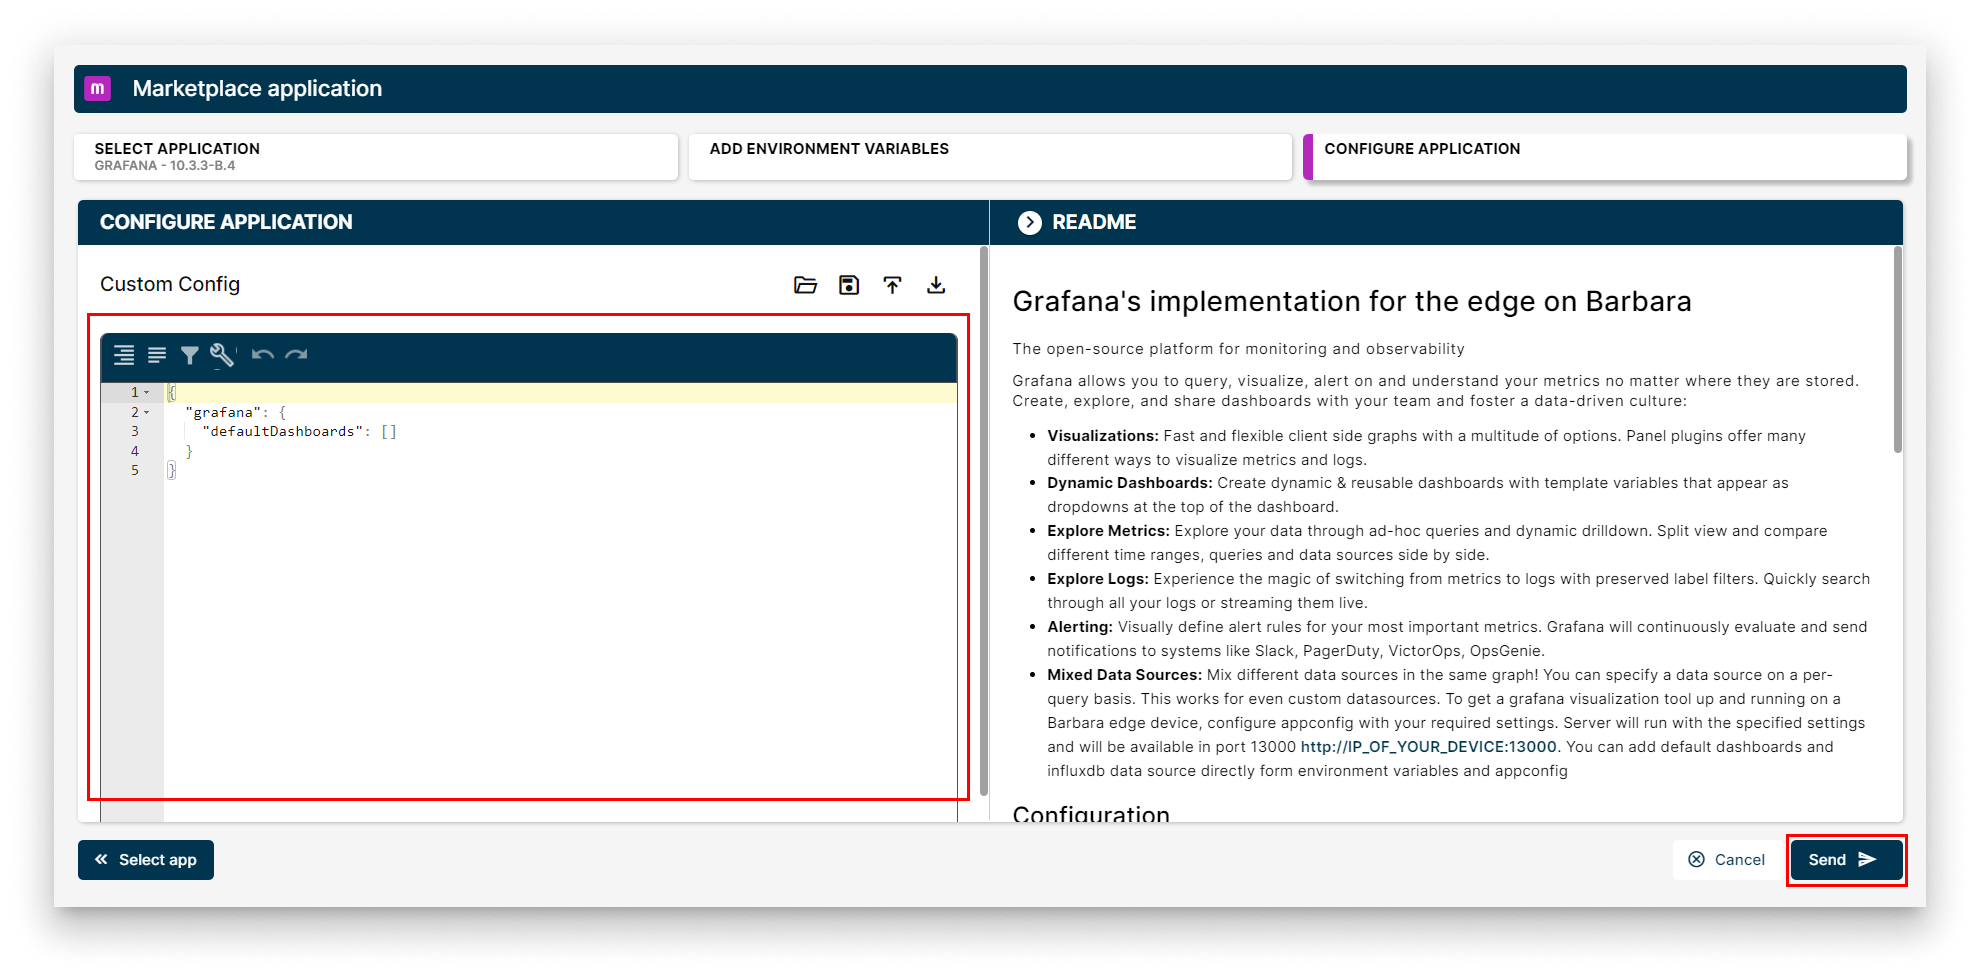
Send the Grafana deployment
Verify the deployment
A new Grafana workload card appears on the Node Details page. When it turns green (Started), Grafana is up.
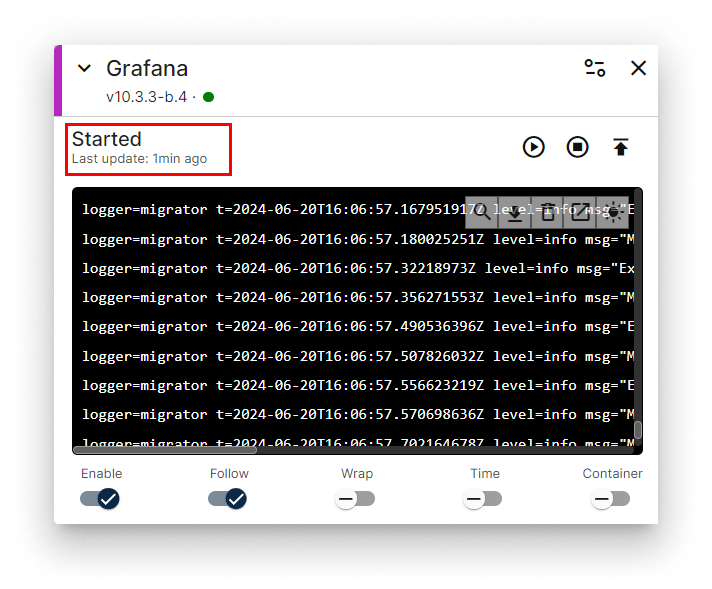
Grafana workload card
Access Grafana
Open http://<NODE_IP>:13000 and log in with the credentials set in App Secrets (defaults bbruser / bbrpassword). The node IP is on the Networking card.
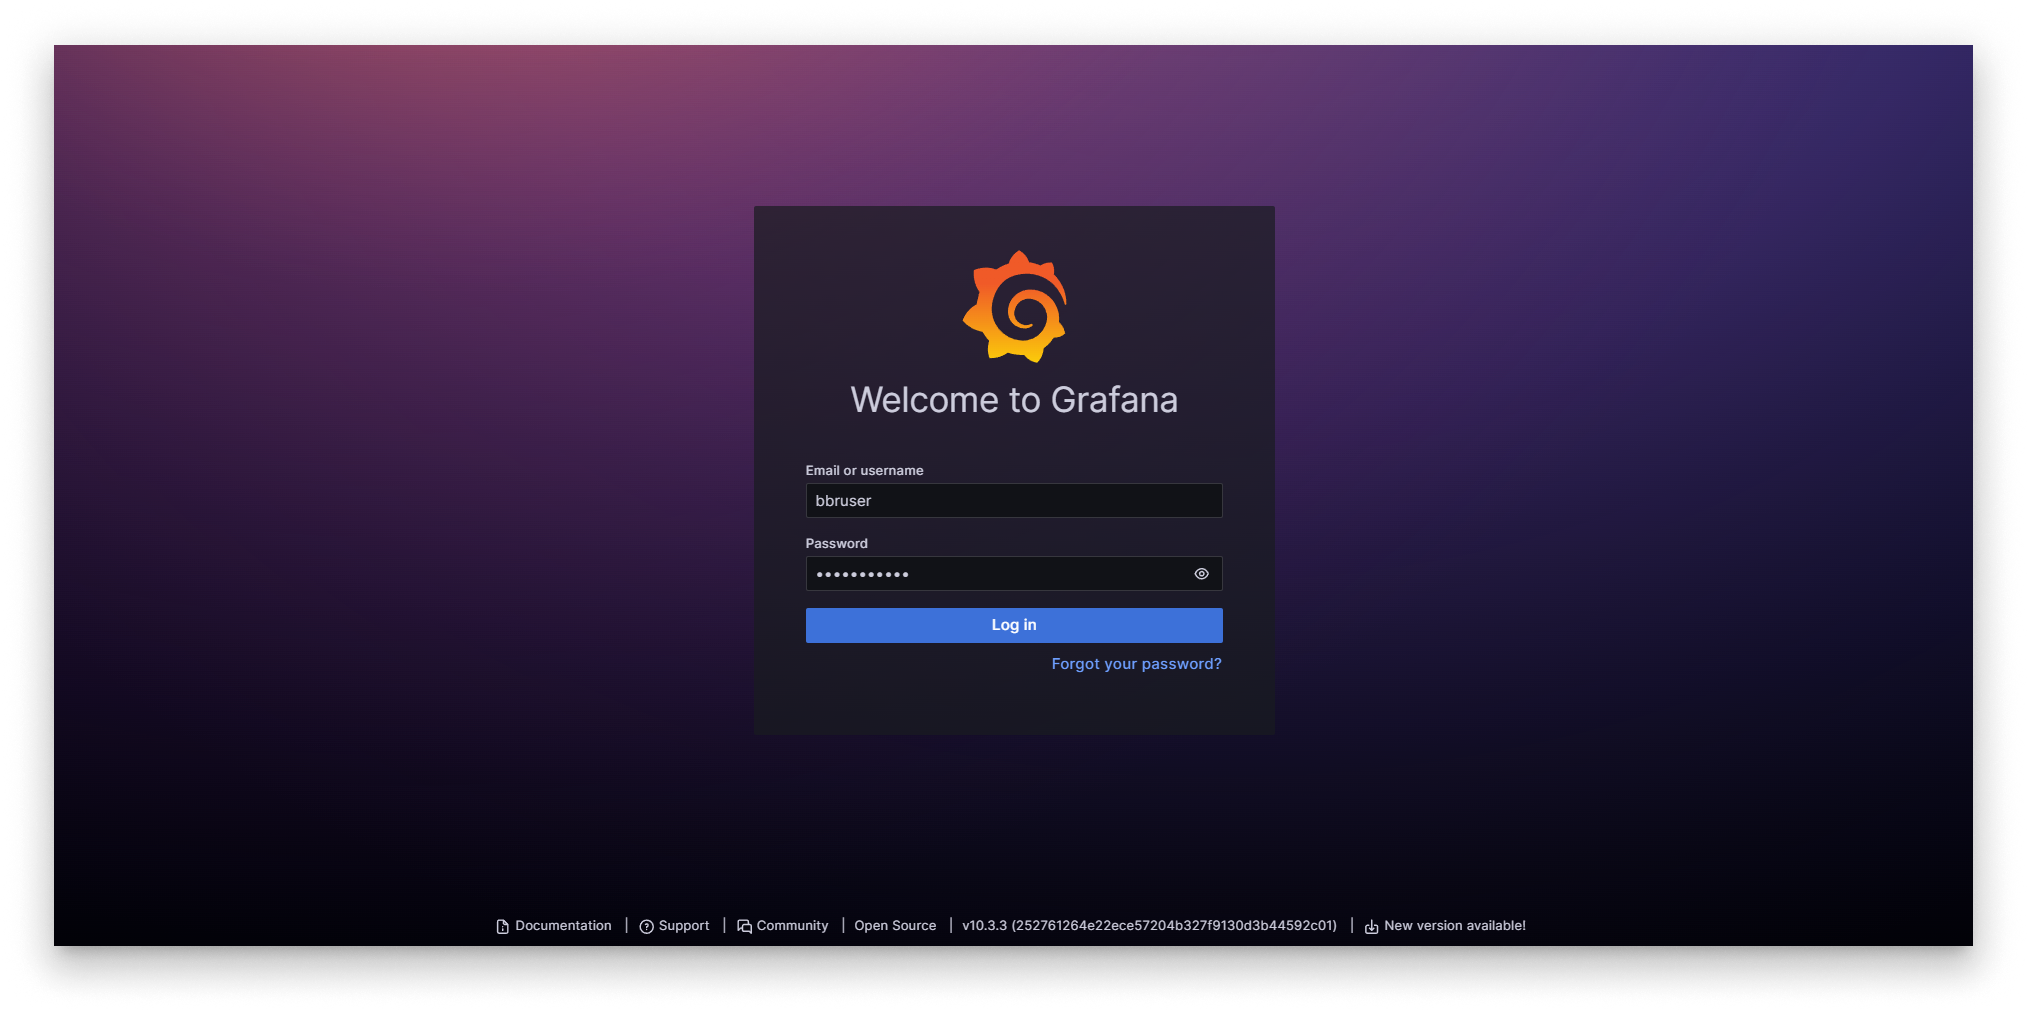
Grafana home
Query InfluxDB from Grafana
- Open Connections → Data sources in the side menu.
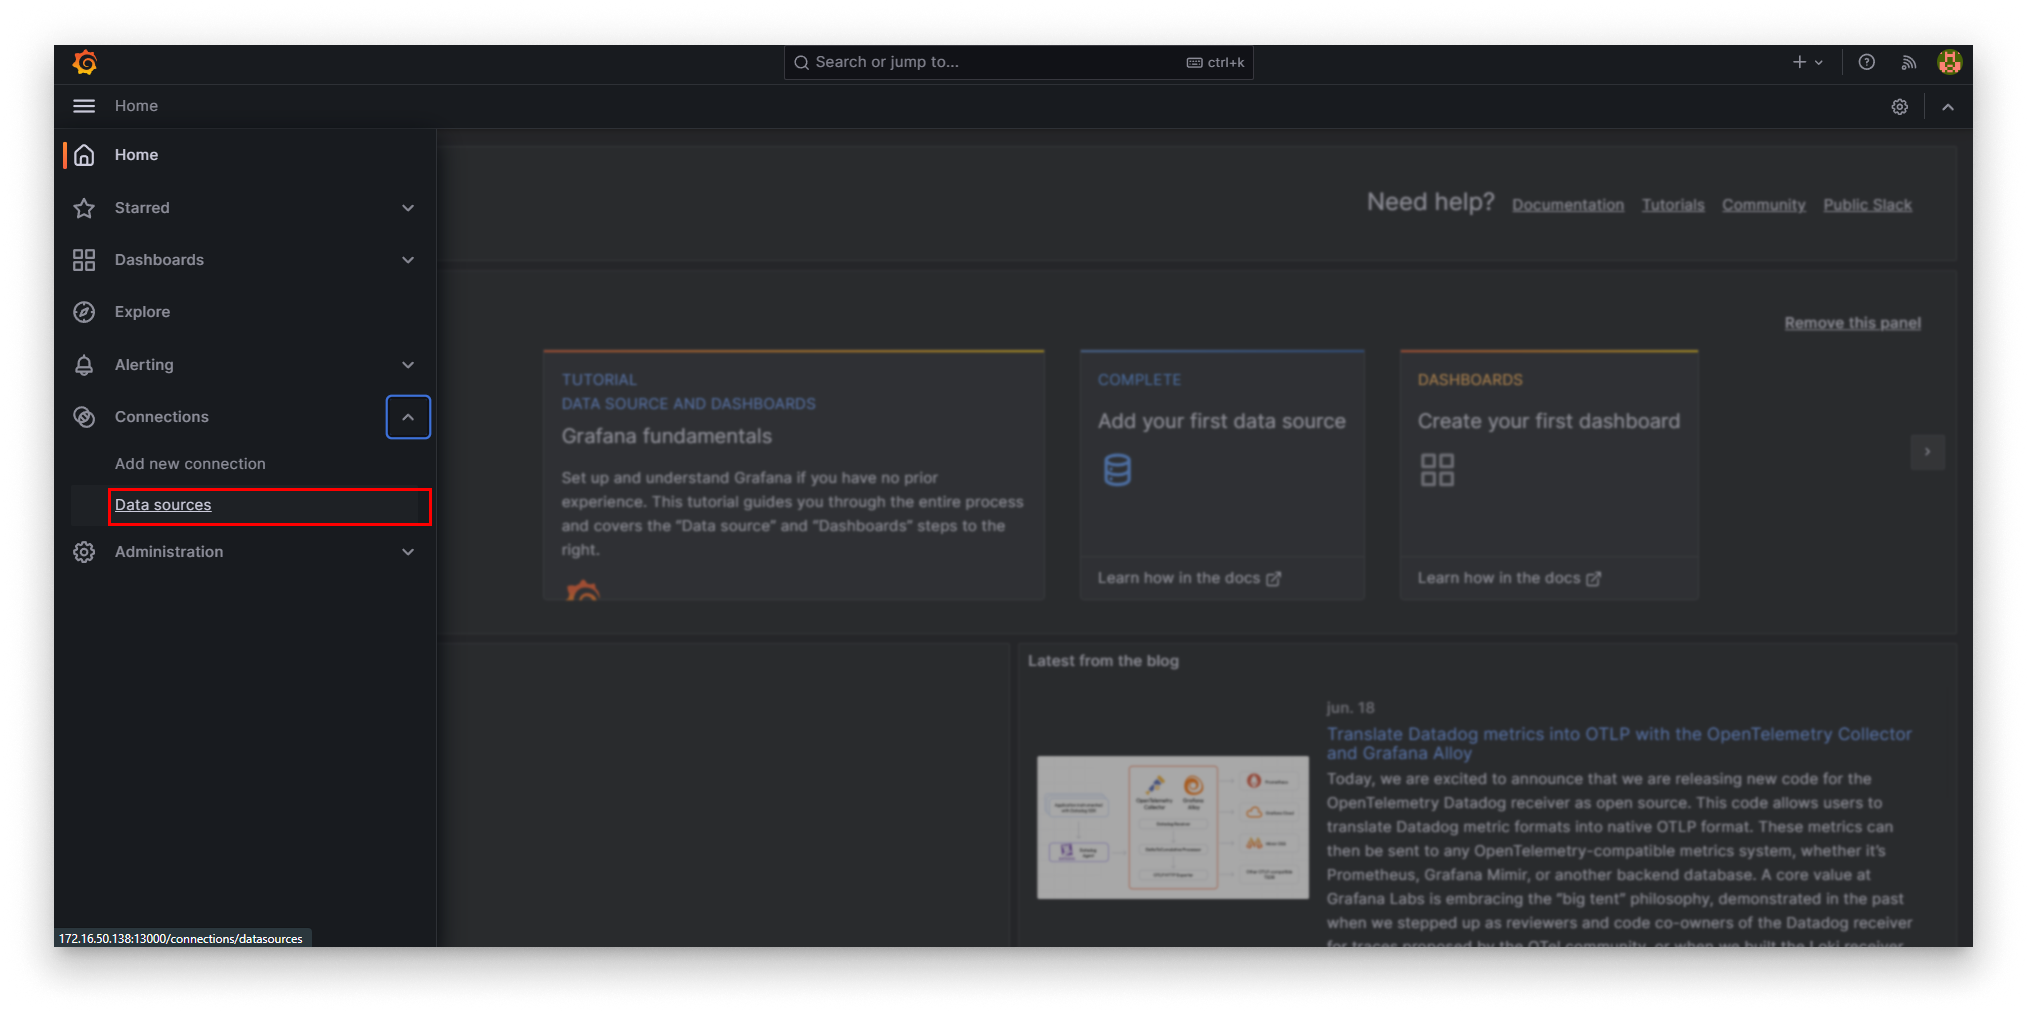
Grafana Data sources
- Open the pre-configured
InfluxDB_BarbaraDefaultdata source.
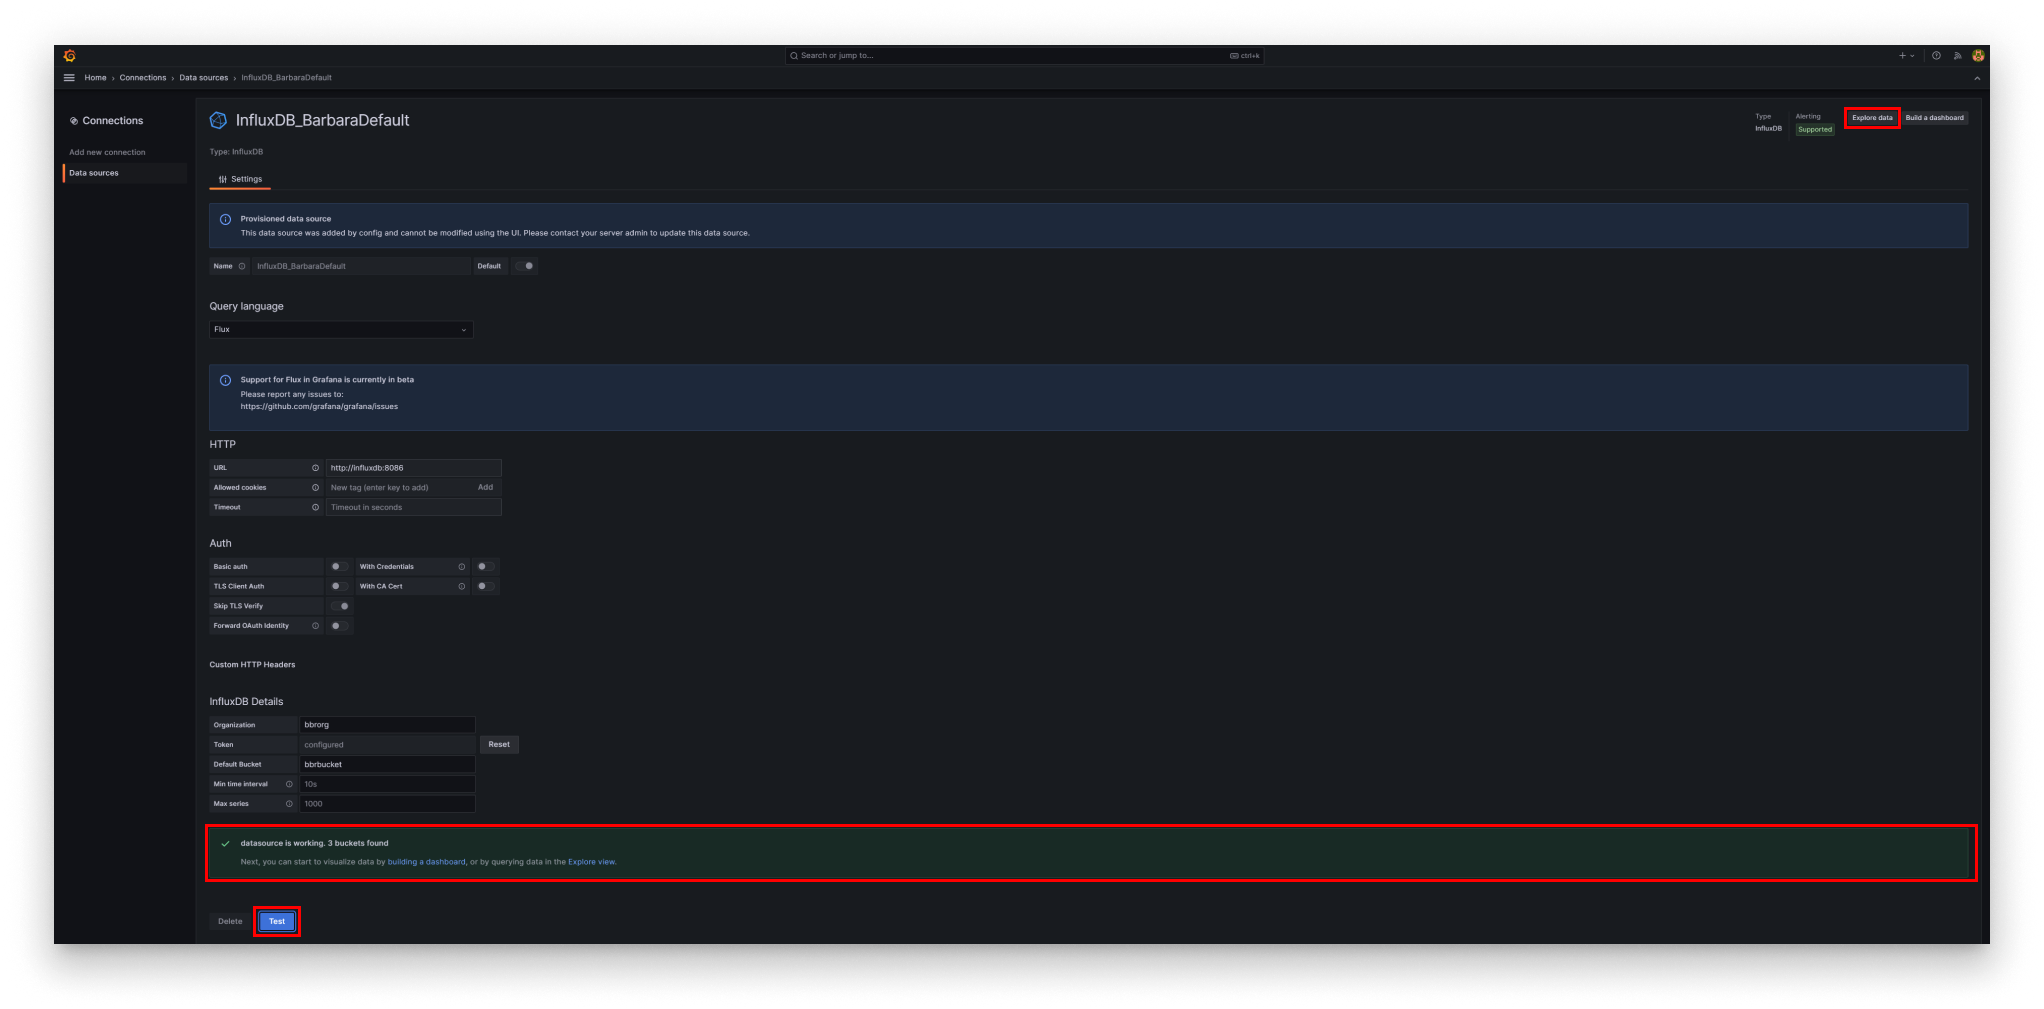
Grafana InfluxDB data source
- Click Test. The data source must report something like
datasource is working. 3 buckets found. - Click Explore data.
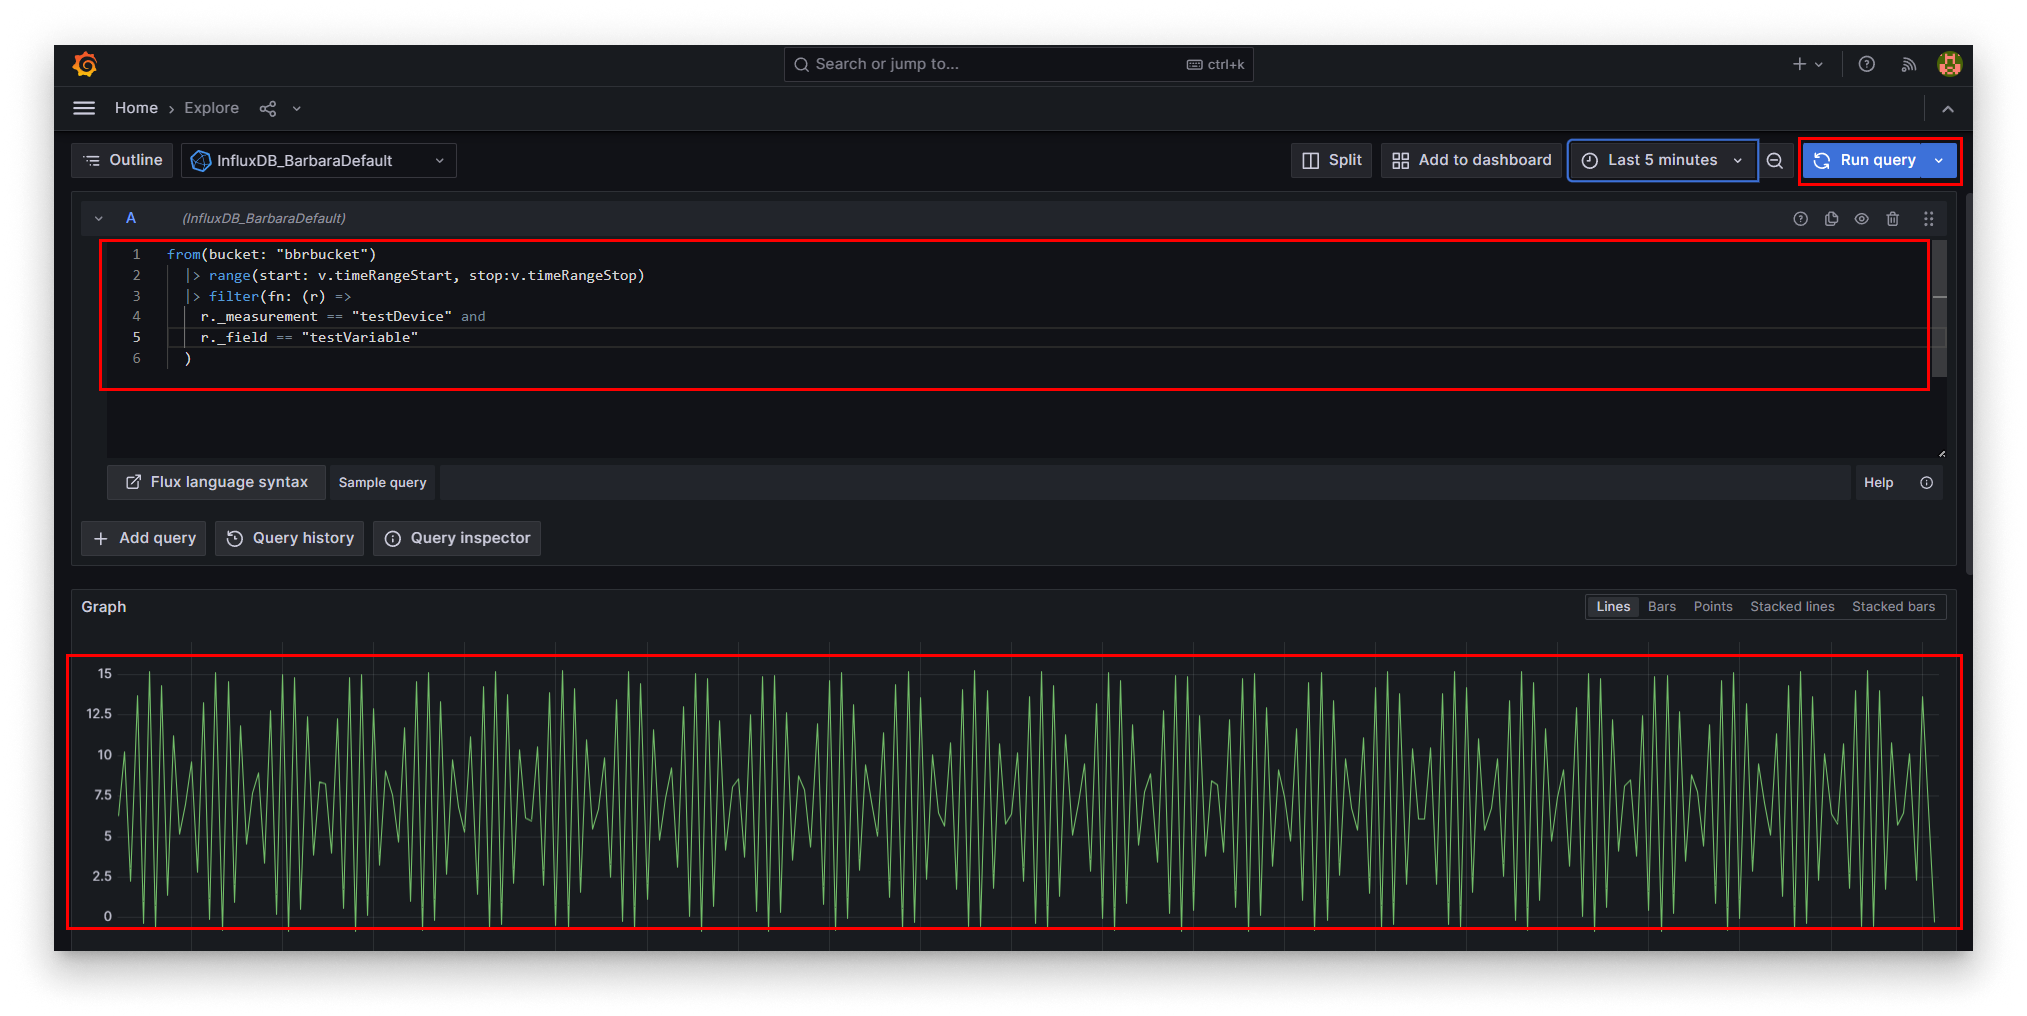
Grafana Explore
-
Paste the Flux query below and click Run query:
from(bucket: "bbrbucket")
  |> range(start: v.timeRangeStart, stop: v.timeRangeStop)
  |> filter(fn: (r) =>
    r._measurement == "testDevice" and
    r._field == "testVariable"
  )
The chart updates with the latest data flowing through the pipeline.
Summary
The pipeline is now complete: simulator → MQTT Broker → Ingester → InfluxDB → Grafana. From here you can build dashboards for the metrics you care about, add alerts, or swap the Industrial Data Simulator for a real connector (see Annex 1: The Modbus connector for an example with real industrial equipment).