Annex 1 — Deploy the Modbus connector
This article refers to Platform v3.0.0. The current Platform version is v3.2.0.
Overview
The Modbus connector is one of the industrial connectors available in Barbara Marketplace. It reads from a Modbus RTU or Modbus TCP interface and publishes the values to the MQTT Broker; it can also subscribe to a topic and write back into the Modbus registry.
You can use it as a drop-in replacement for the Industrial Data Simulator: instead of synthetic data, the rest of the pipeline (InfluxDB, Ingester, Grafana) consumes real telemetry from the connected Modbus equipment.
This connector requires a running MQTT Broker on the same node before you deploy it.
Deploy the Modbus connector
- Open the Node Details page and click Add card.
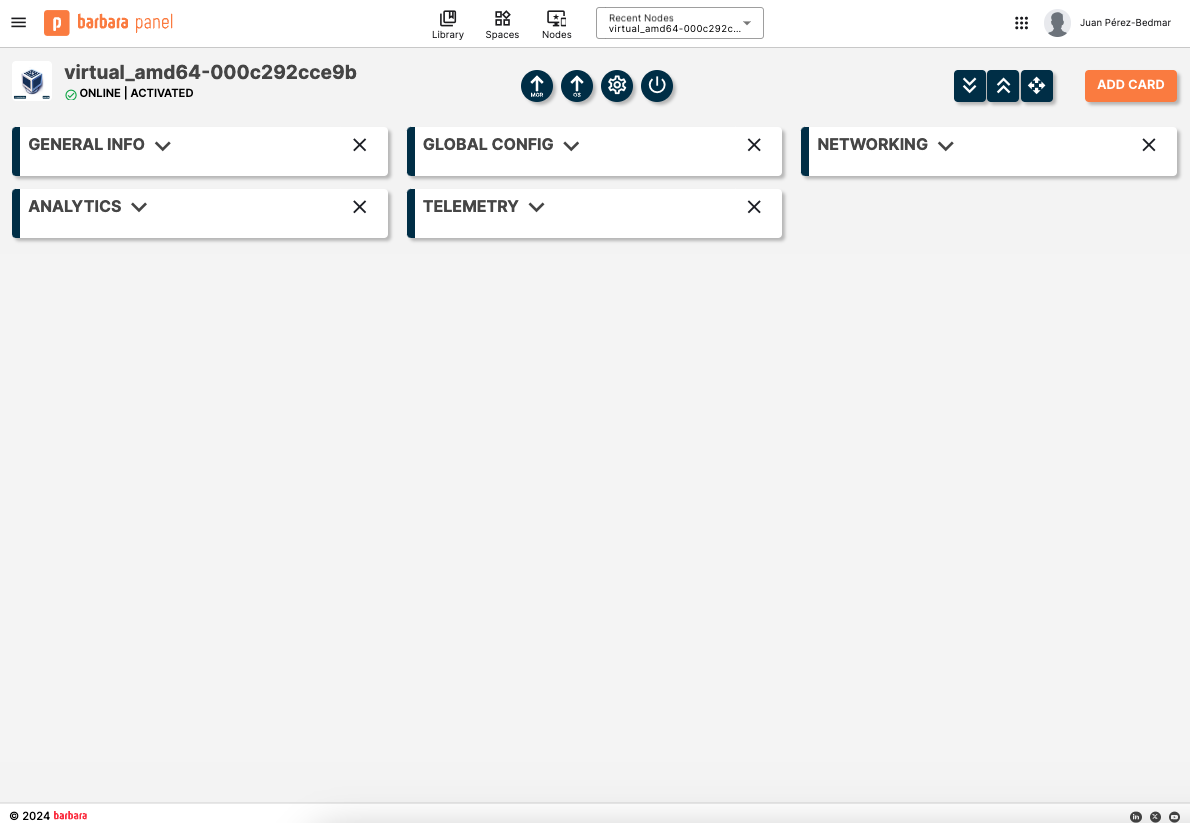
Add card
- Pick Marketplace App.
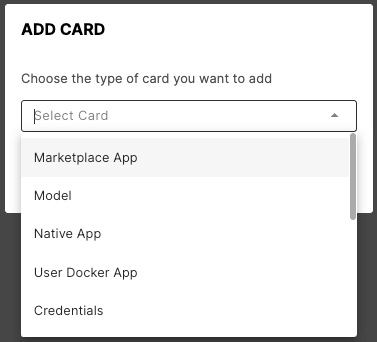
Select Marketplace App
- Select app and version. Pick Modbus Connector and its latest version. Click Next.
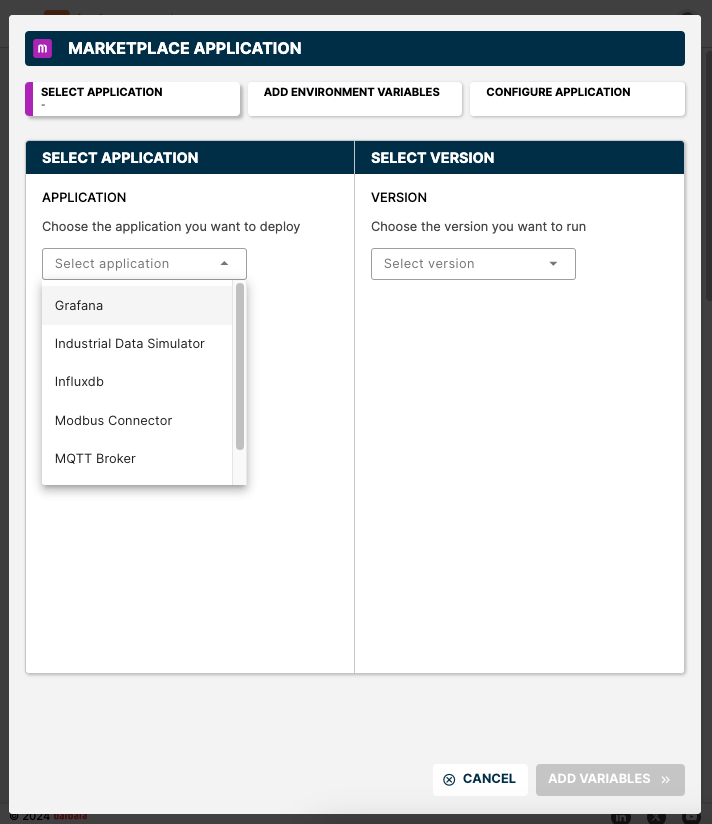
Select the Modbus connector
-
App Secrets. The connector ships with a sensible set of defaults that wire it to the MQTT Broker on the same node. Adjust them only if you changed the broker defaults in Step 1.
Name Default value MQTT BROKER USERbbruserMQTT BROKER PASSWORDbbrpasswordMQTT BROKER PORT8883MQTT BROKER HOSTNAMEmqttbbrMODBUS CLIENT IDconnector_modbusMQTT PUB TOPICapi/v1/reads/MQTT SUBSCRIPTION TOPICapi/v1/write/#MQTT SUBSCRIPTION TOPIC QOS0Click Next.
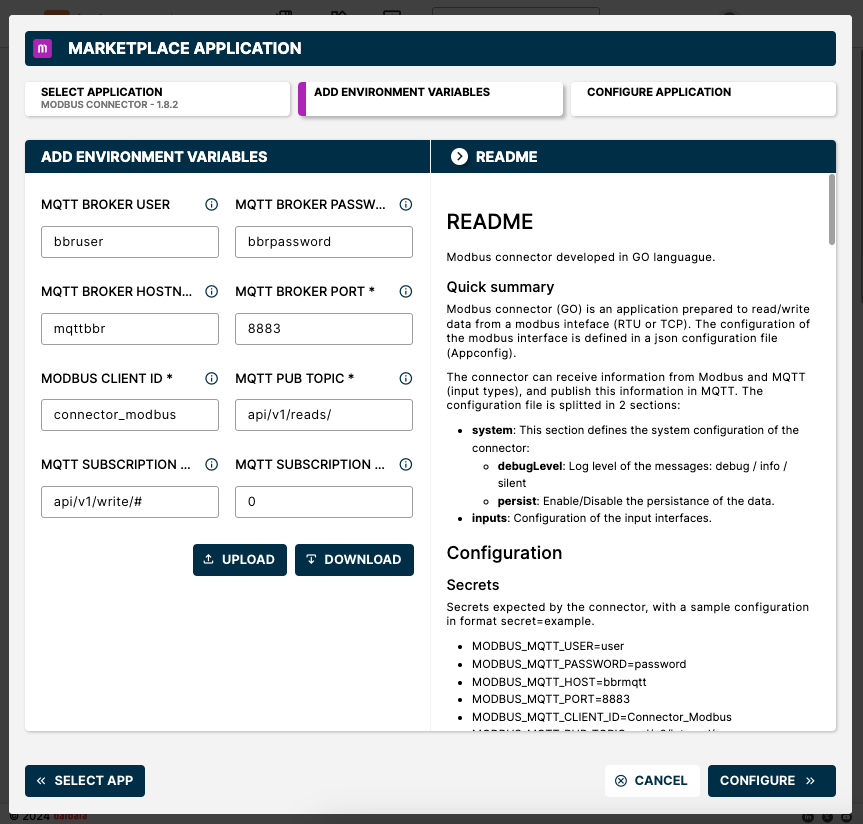
App Secrets for the Modbus connector
-
App Config. The wizard preloads a JSON template that describes the Modbus connection and the data points to read.
{
  "connectorModbus": {
    "system": {
      "debugLevel": "info",
      "persist": true,
      "refreshMs": 1000,
      "resetOnFailure": false,
      "resetOnFailureAttemps": 3,
      "rwGapTimeMs": 100
    },
    "inputs": [
      {
        "connection": {
          "type": "tcp",
          "server": "127.0.0.1",
          "port": 502,
          "baudRate": 9600,
          "parity": "N",
          "dataBits": 8,
          "stopBits": 1,
          "timeoutMs": 500
        },
        "devices": [
          {
            "slaveId": 1,
            "deviceDisplayName": "",
            "mapping": [
              {
                "displayName": "",
                "address": 0,
                "access": "",
                "bitQuantity": 0,
                "dataType": "",
                "registerType": "",
                "bigEndian": true,
                "correctionFactor": 0,
                "ieee754": true
              }
            ]
          }
        ]
      }
    ]
  }
}
Adjust the values to match the real Modbus device you are connecting to. The right-hand panel of the wizard explains every field.
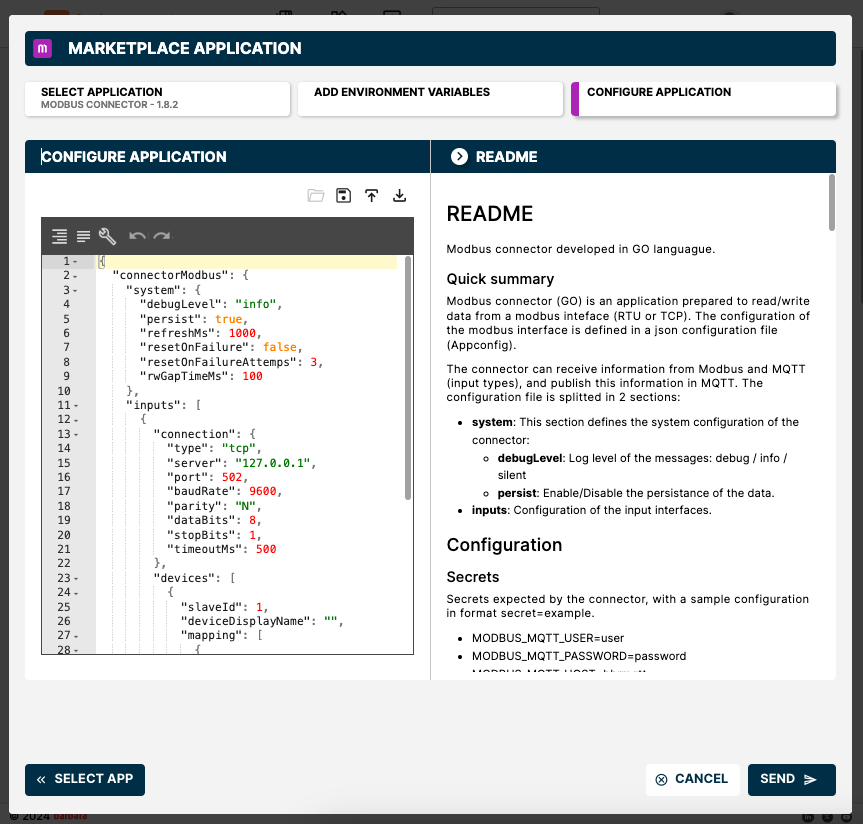
App Config for the Modbus connector
- Click Send App to deploy.
Verify the deployment
A new Modbus connector workload card appears on the Node Details page. When the indicator turns green (Started), the connector is reading from the configured Modbus interface and publishing every reading to the MQTT Broker.
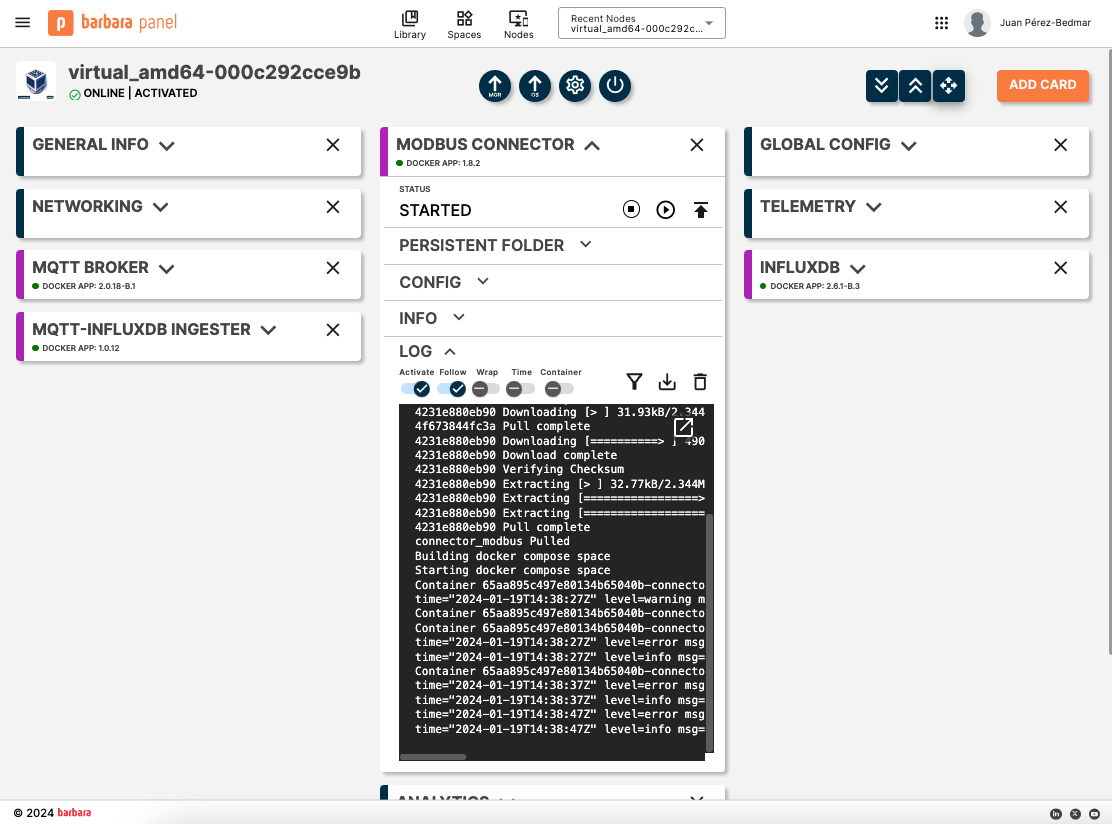
Modbus connector workload card
The connector publishes to topics rooted at the MQTT PUB TOPIC you set in App Secrets (default api/v1/reads/) and subscribes to MQTT SUBSCRIPTION TOPIC (default api/v1/write/#) for write commands.
Summary
The Modbus connector is a real-equipment alternative to the Industrial Data Simulator. With it deployed alongside the rest of the stack, the InfluxDB Ingester captures live Modbus data and Grafana visualises it without any other change to the pipeline.