Step 7 — Deploy Grafana
This article refers to Platform v3.0.0. The current Platform version is v3.4.0.
This step assumes the previous six steps are already running on the node (MQTT Broker → Ingester).
Overview
Grafana turns the YOLOv8 inference telemetry stored in InfluxDB into a live dashboard. This step deploys Grafana and pre-loads a tutorial dashboard via App Config so you do not need to build one from scratch.
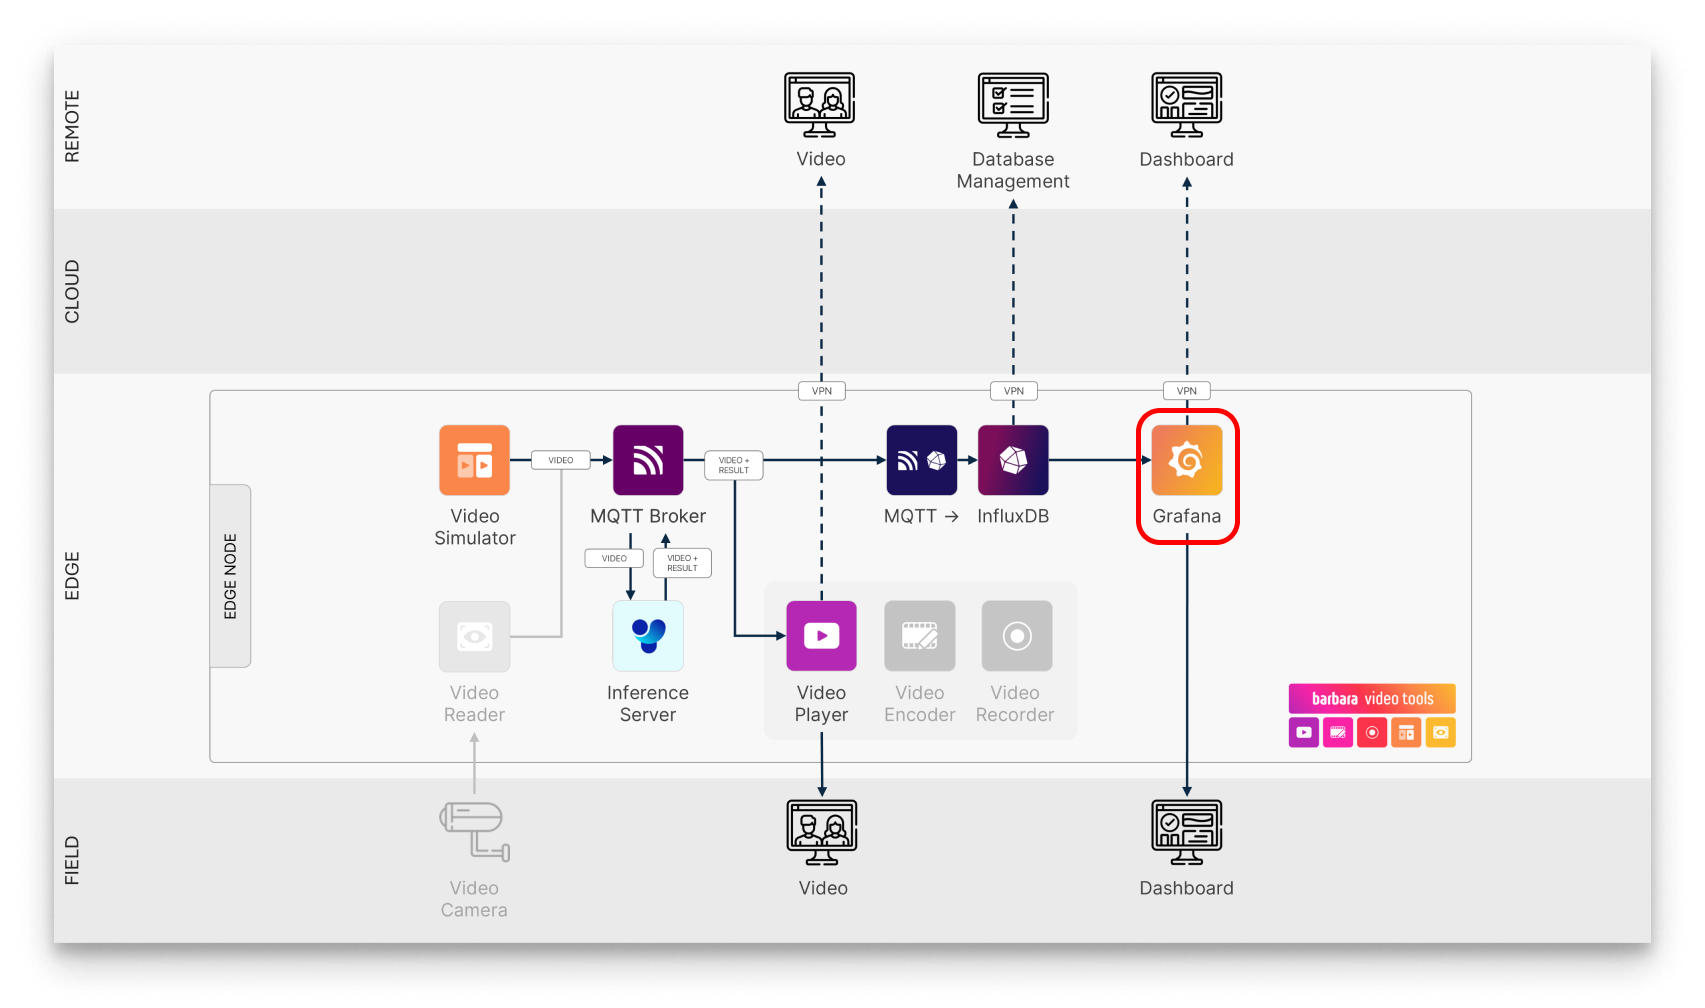
Grafana in the pipeline
Add Grafana to your Library


Grafana
Data-visualisation platform for building interactive dashboards from time-series data.
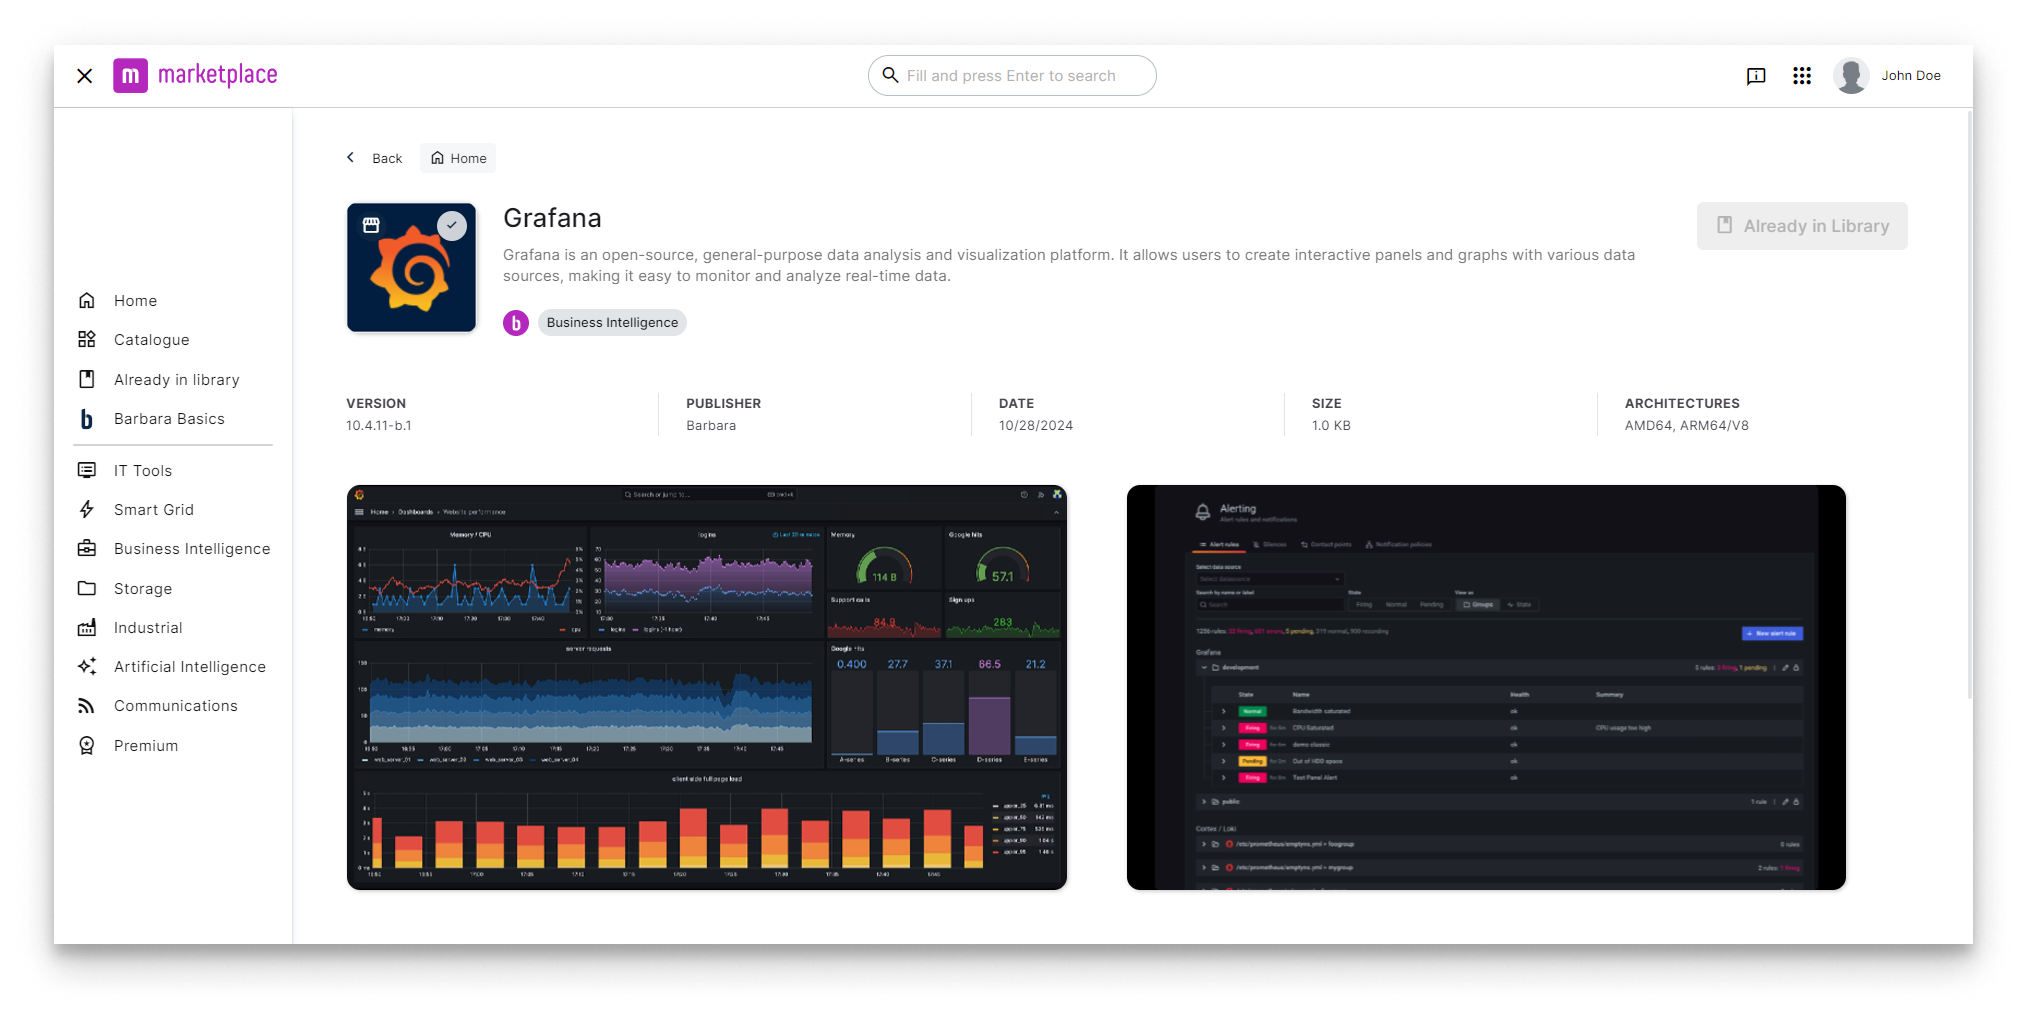
Grafana in the Marketplace
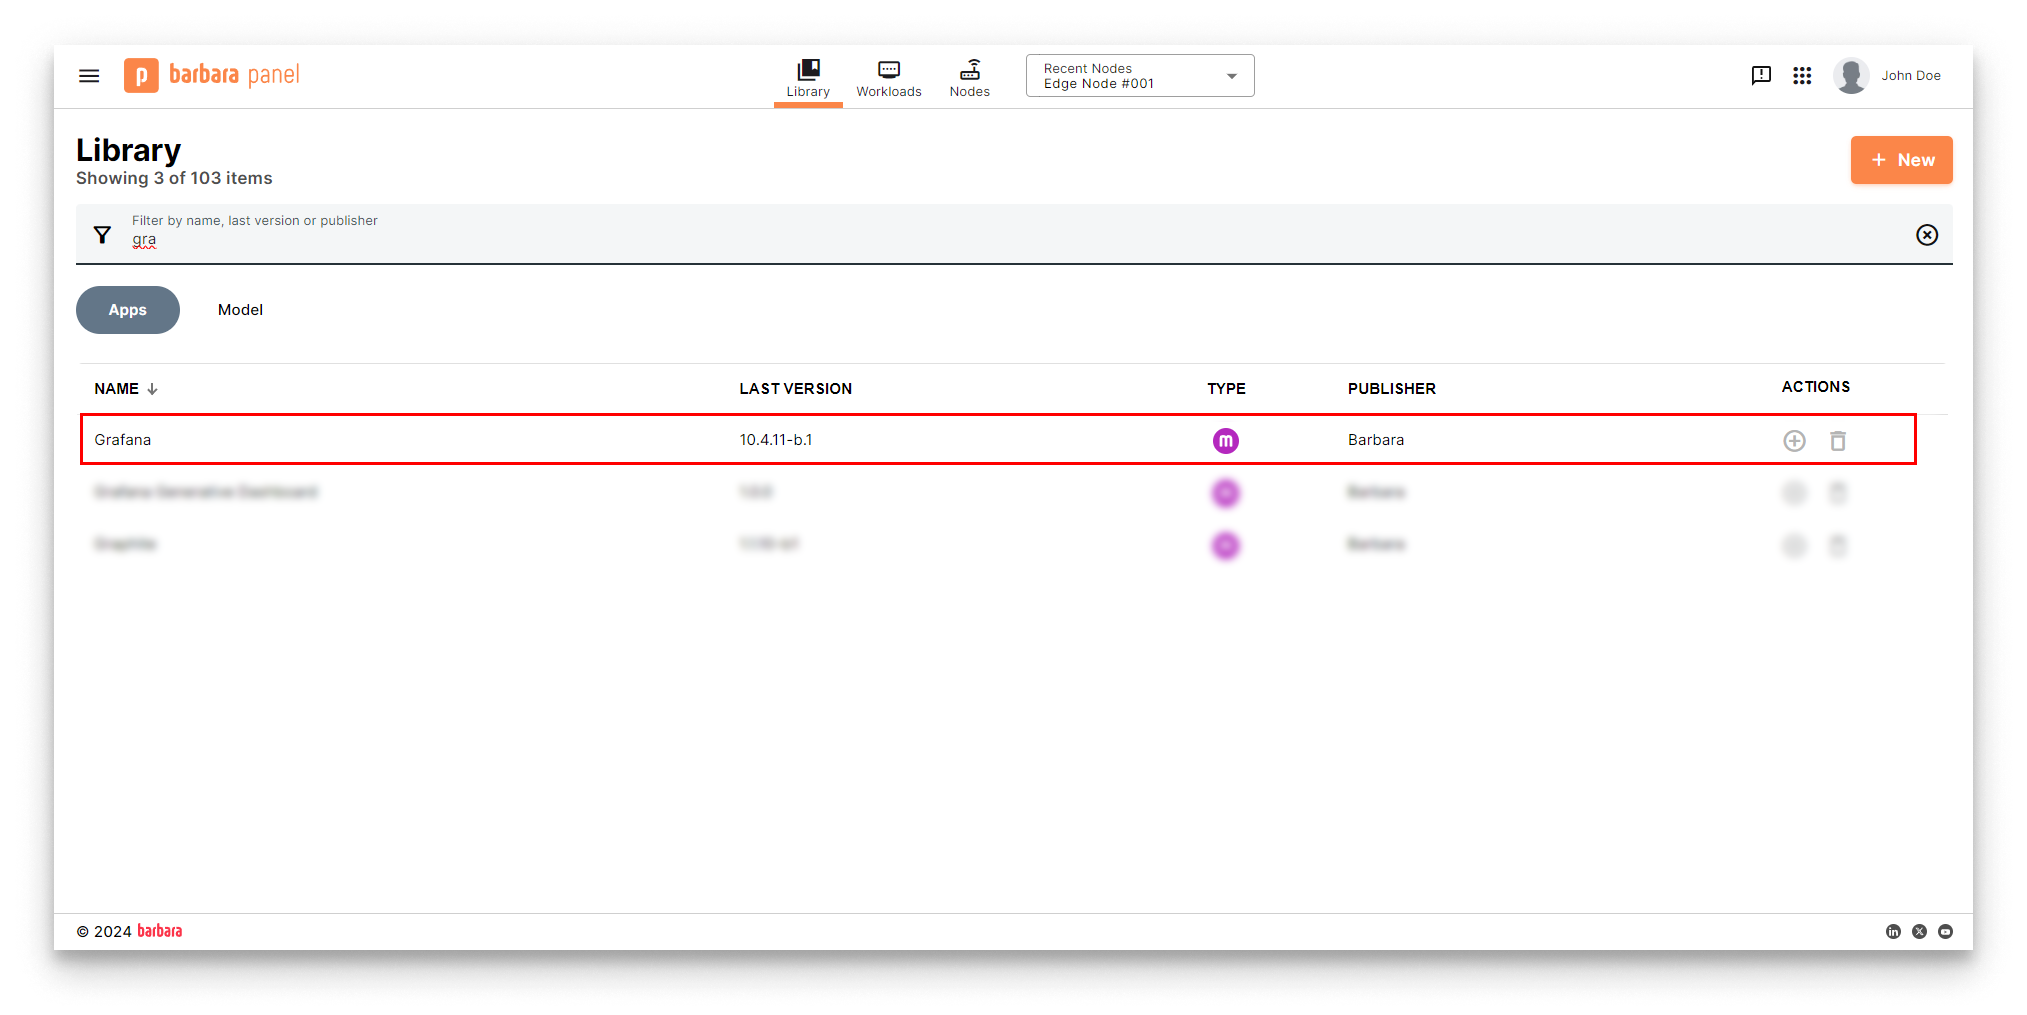
Grafana in the App Library
Deploy Grafana
- Open the Node Details page and click Add card → Application.
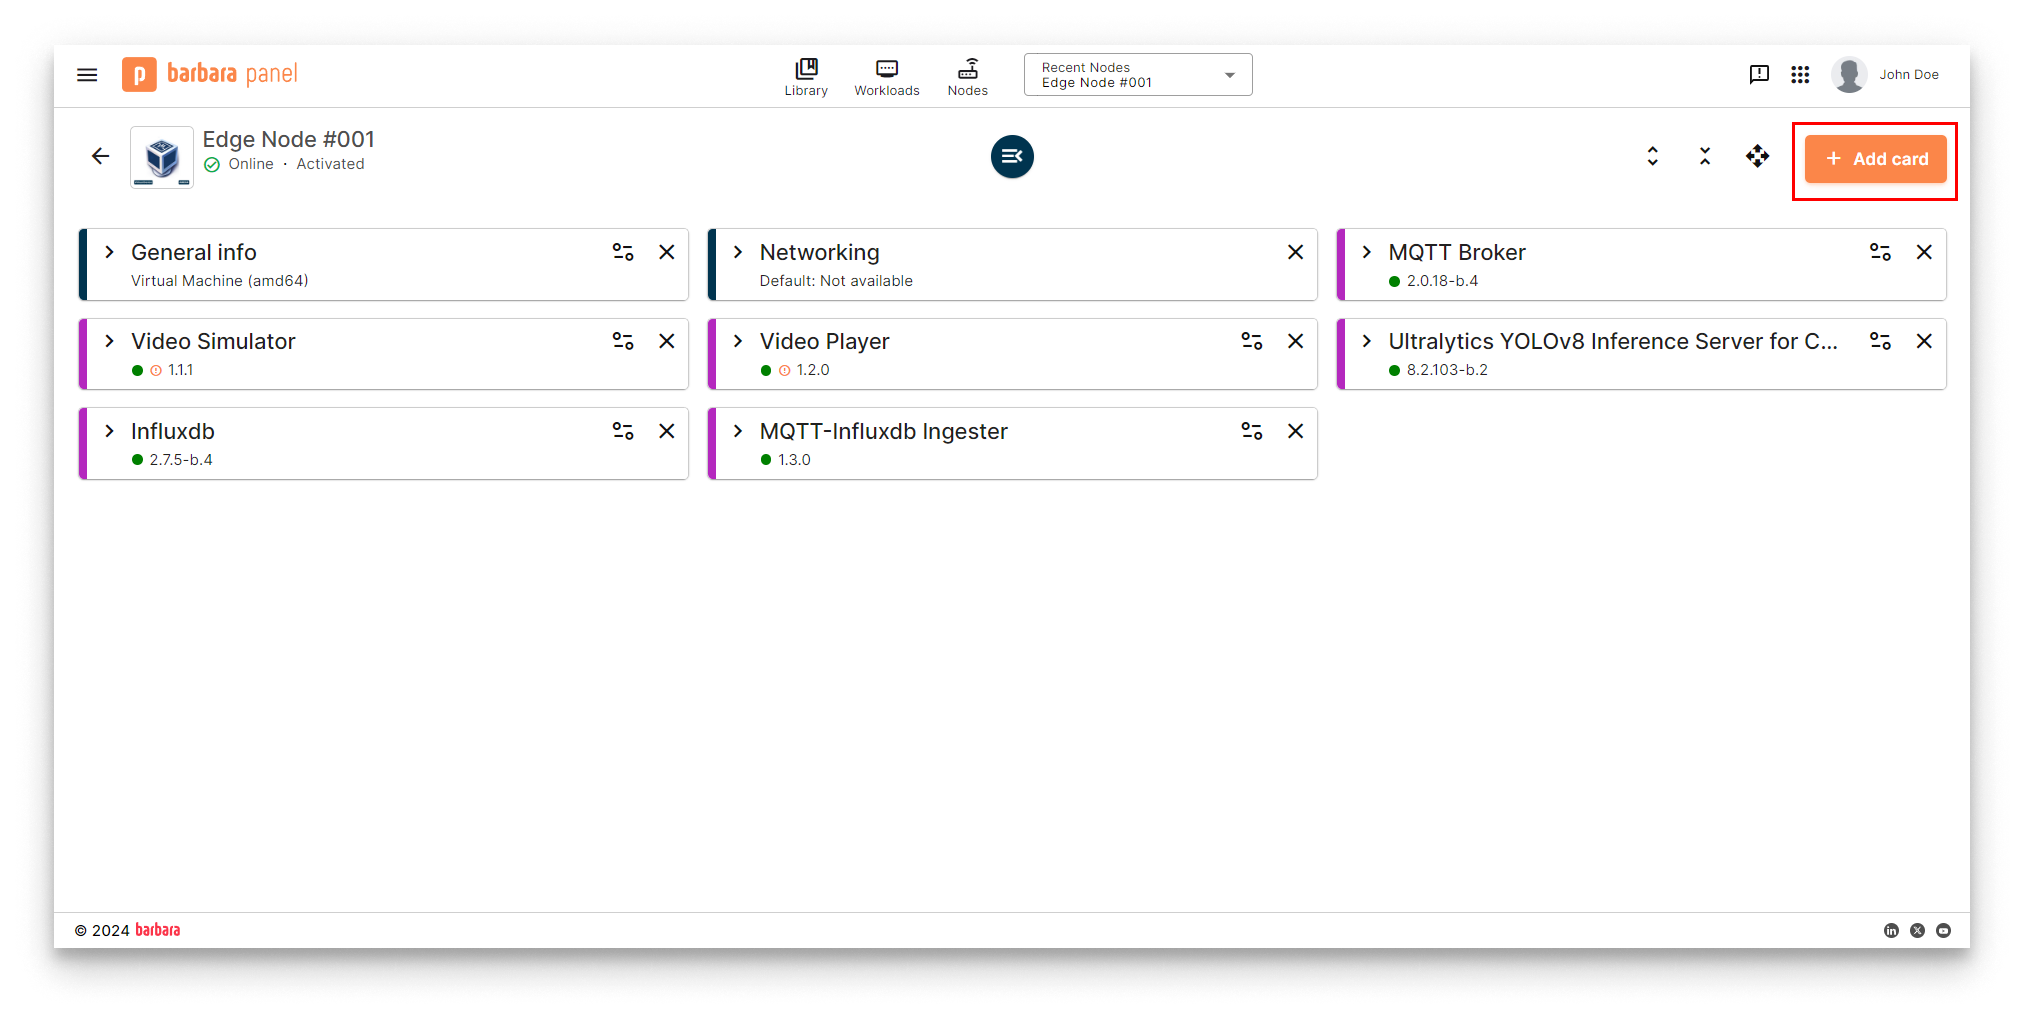
Add card menu
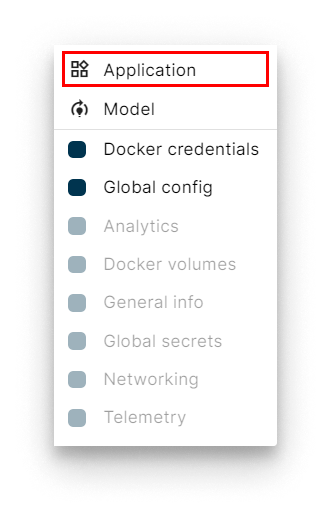
Select Application
- Select app and version. Pick Grafana and its latest version. Click Next.
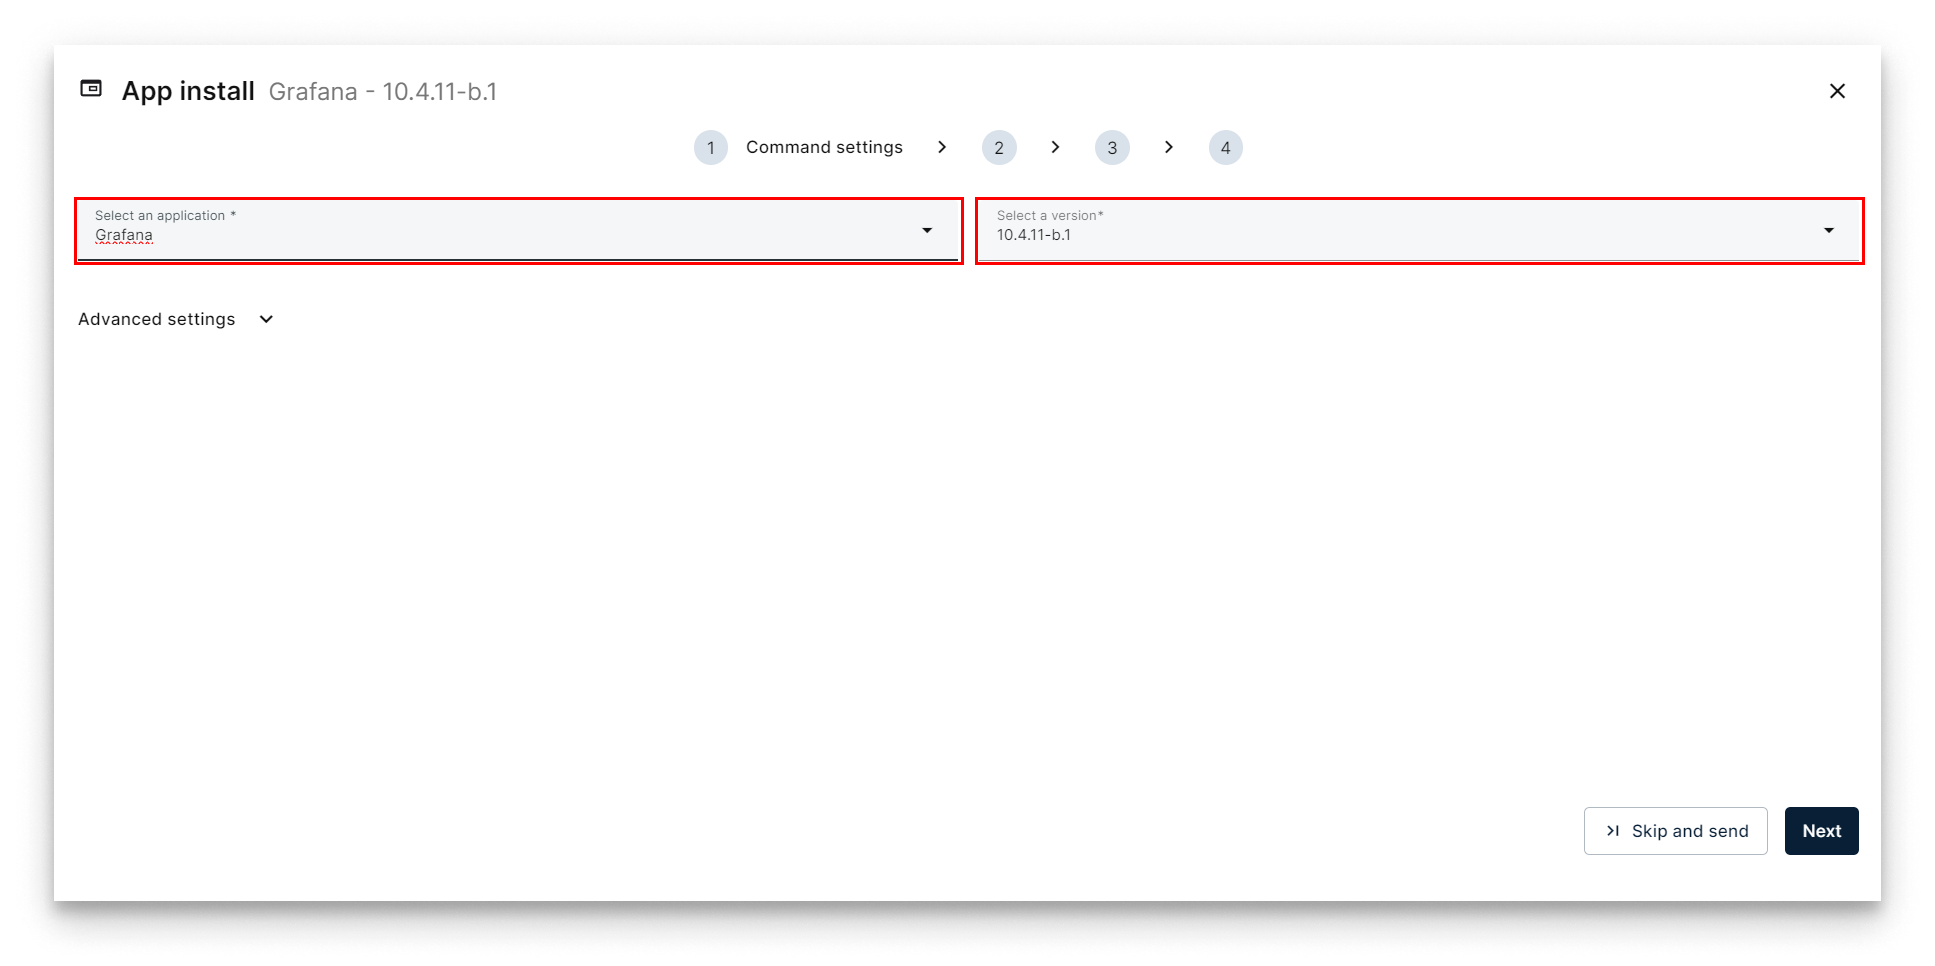
Select Grafana
- App Secrets. Keep the defaults and click Next.
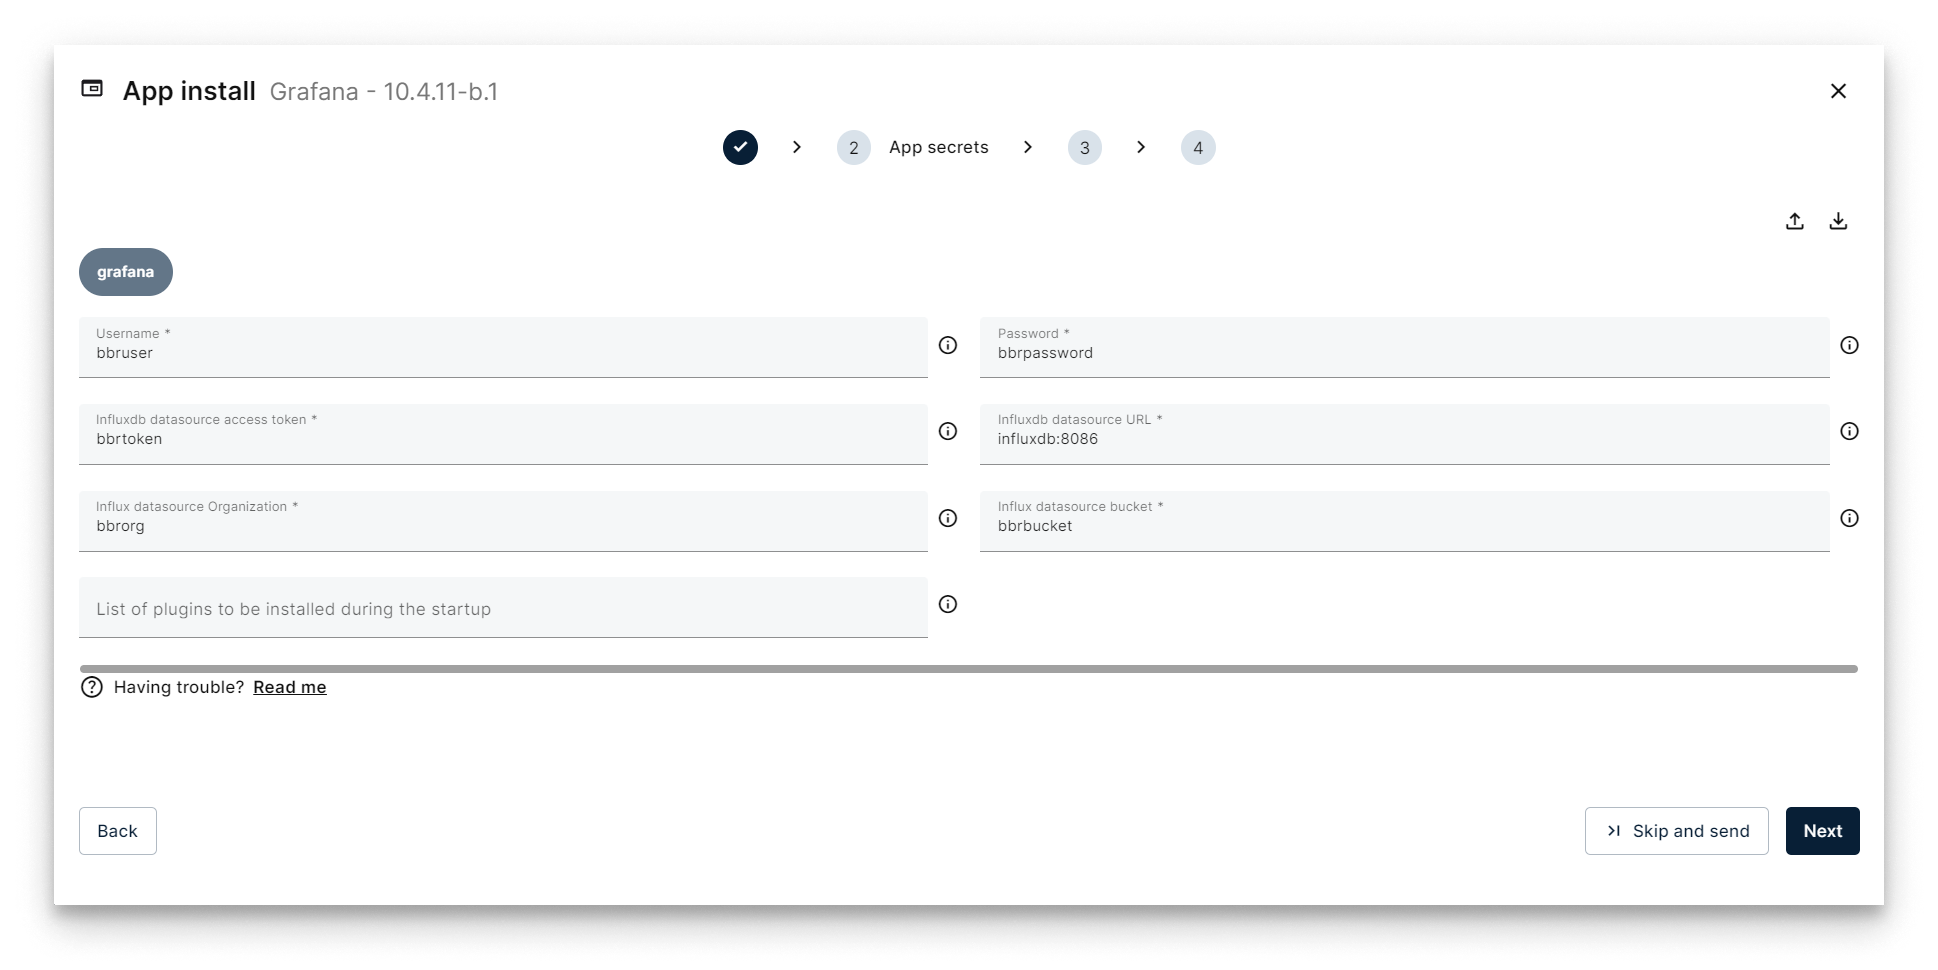
App Secrets for Grafana
-
App Config. Paste the pre-built dashboard JSON into the editor. The tutorial ships one for the YOLOv8 telemetry:
Grafana_config.jsonDownload the pre-built dashboard: Grafana_config.json.
With this JSON loaded, Grafana auto-imports the dashboard on first start.
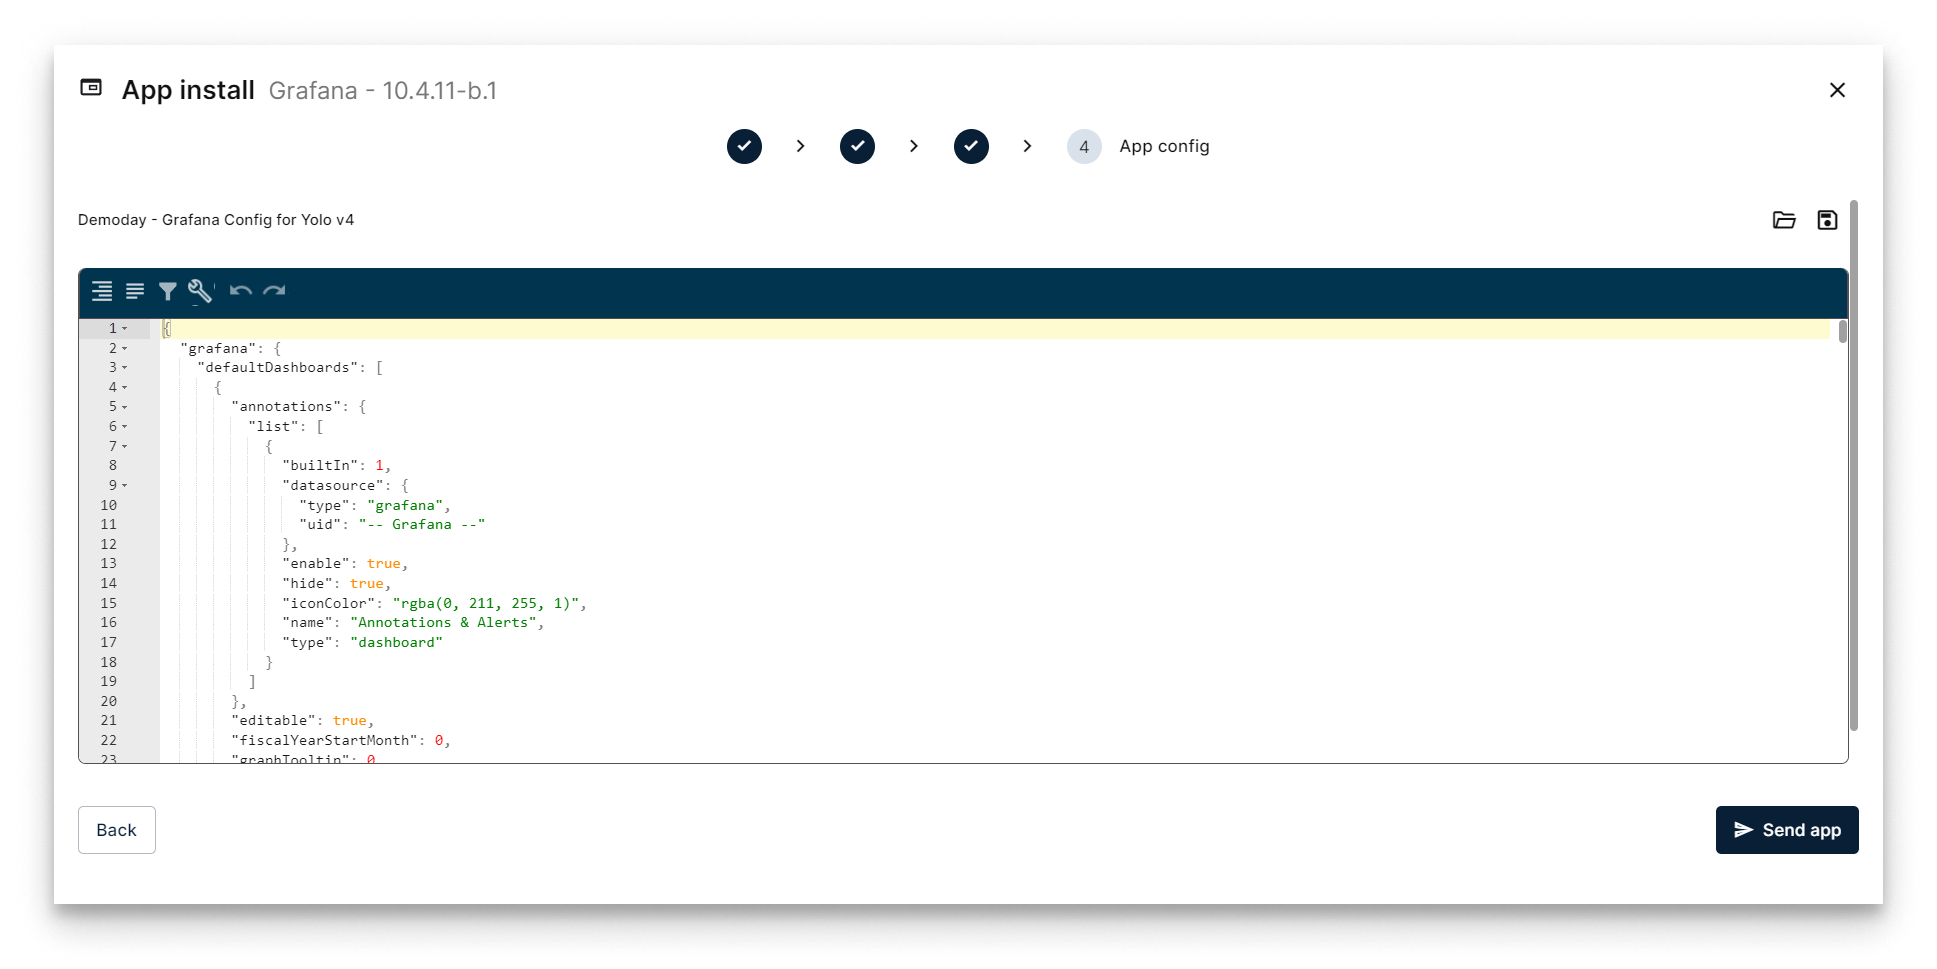
Send Grafana deployment with pre-built dashboard
- Click Send App.
Verify the deployment
The Grafana workload card appears on the Node Details page. When it turns green (Started), Grafana is up.
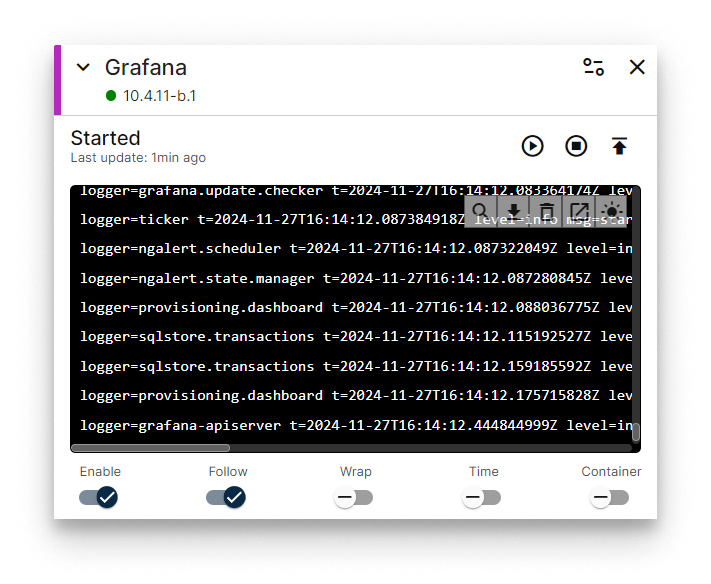
Grafana workload card
Access Grafana
Open http://<NODE_IP>:13000 and log in with the credentials defined in App Secrets (defaults bbruser / bbrpassword).
| Parameter | Default value | Set in |
|---|---|---|
| Port | 13000 | Compose Config |
| User | bbruser | App Secrets |
| Password | bbrpassword | App Secrets |
If your laptop is on a different network than the node, enable the VPN and use the node's VPN IP instead.
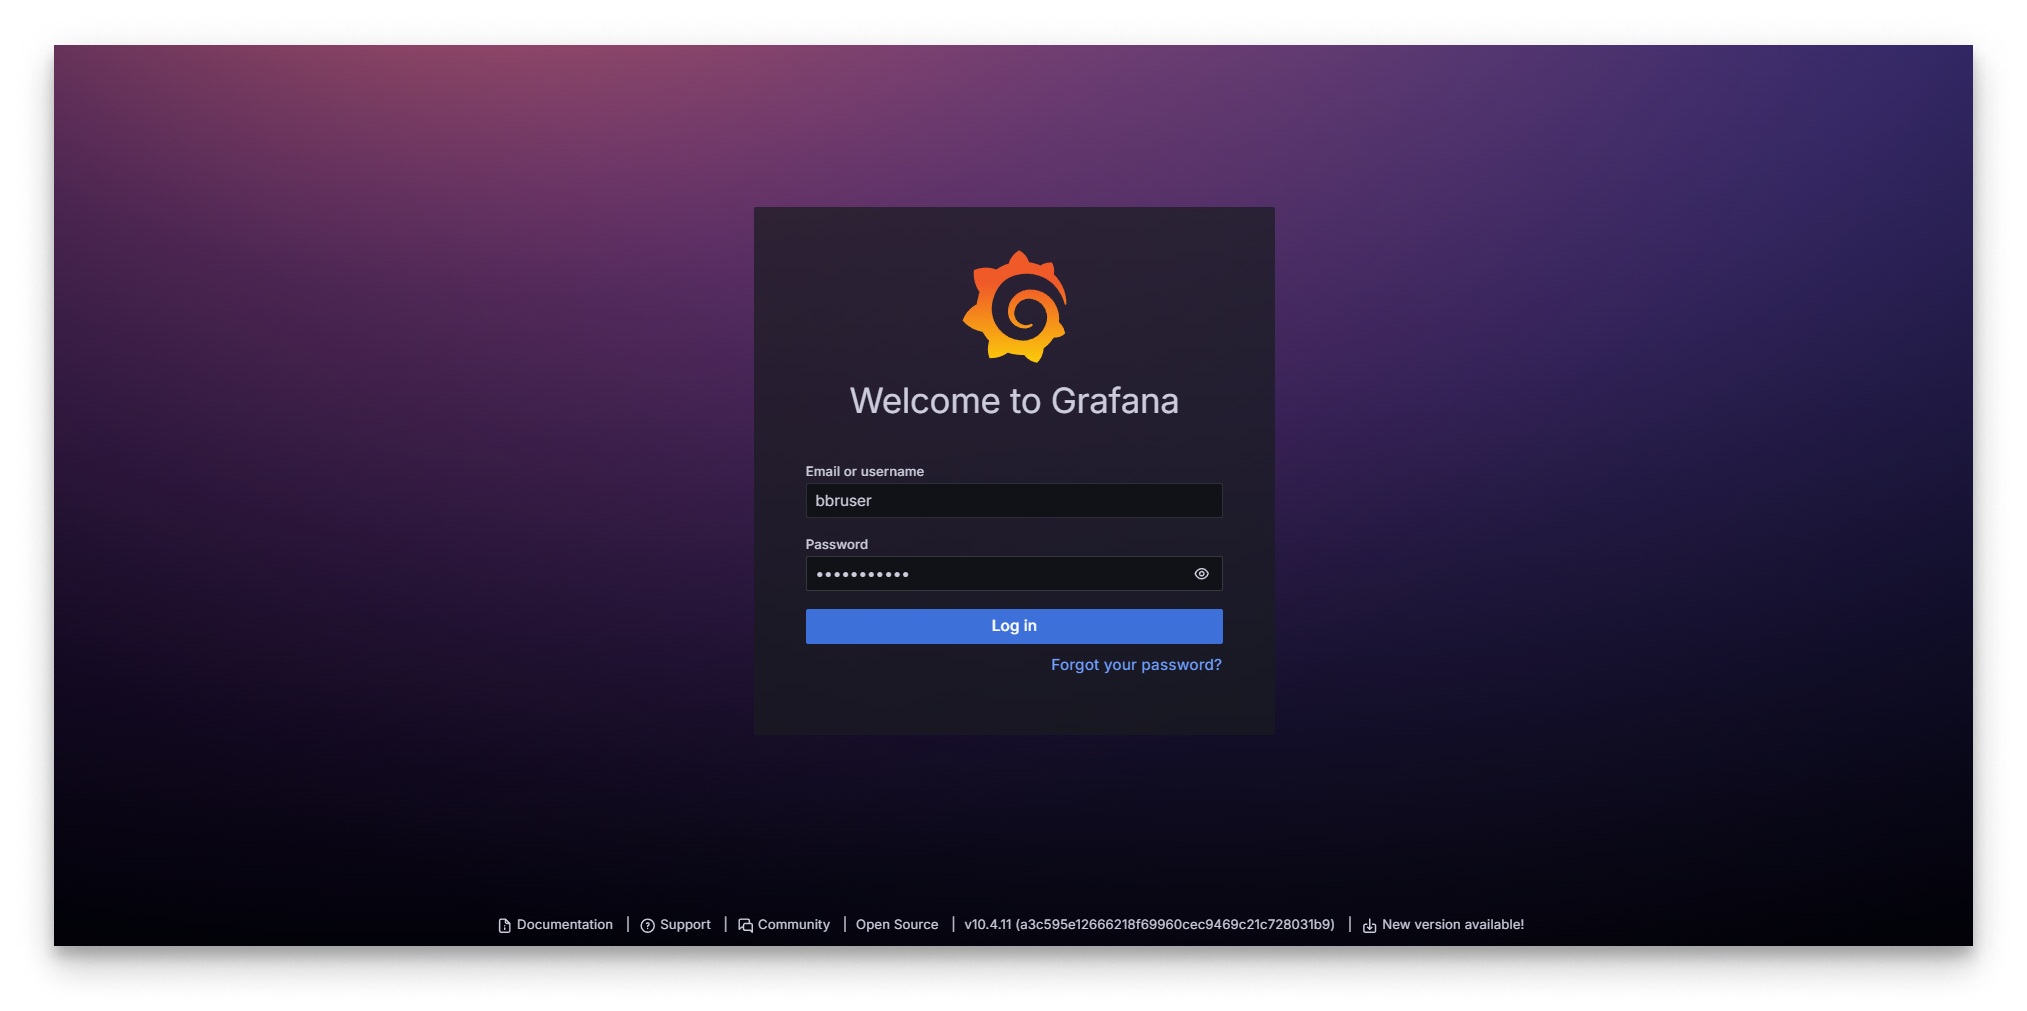
Grafana login
After login, Grafana opens the pre-loaded dashboard built around the YOLOv8 telemetry stored in InfluxDB.
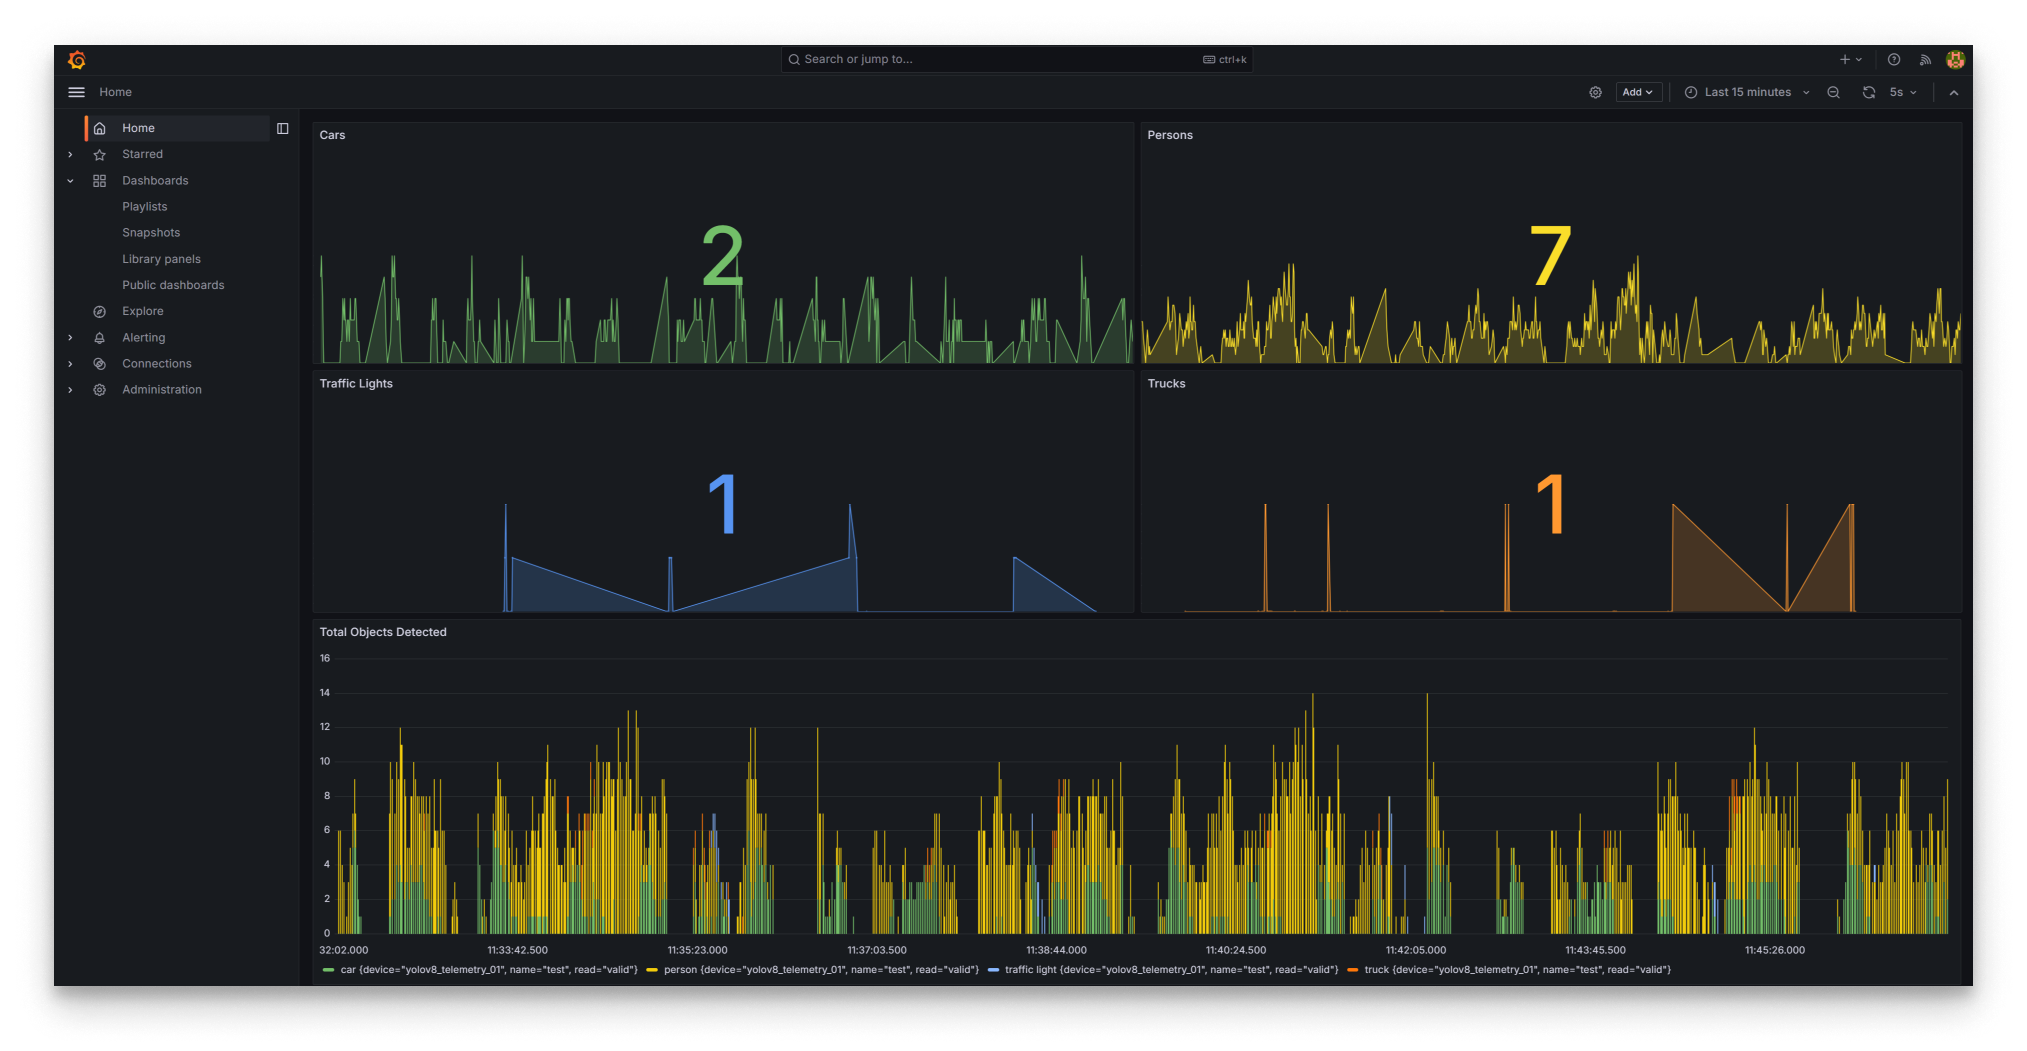
YOLOv8 dashboard in Grafana
Summary
The full computer-vision pipeline is now running end to end on a single edge node: simulator → MQTT Broker → YOLOv8 → Video Player → MQTT-InfluxDB Ingester → InfluxDB → Grafana. From here you can extend the dashboard, swap the simulator for a real camera with the Video Reader app, or replace coco_yolov8n with one of the other pre-trained models or your own TorchScript model.