Step 6 — Deploy the MQTT-InfluxDB Ingester
This article refers to Platform v3.0.0. The current Platform version is v3.4.0.
This step assumes the previous five steps are already running on the node (MQTT Broker → InfluxDB).
Overview
The MQTT-InfluxDB Ingester is the bridge between MQTT and InfluxDB. It subscribes to the YOLOv8 telemetry stream on the broker and writes every message into an InfluxDB bucket, ready to be queried from Grafana in the next step.
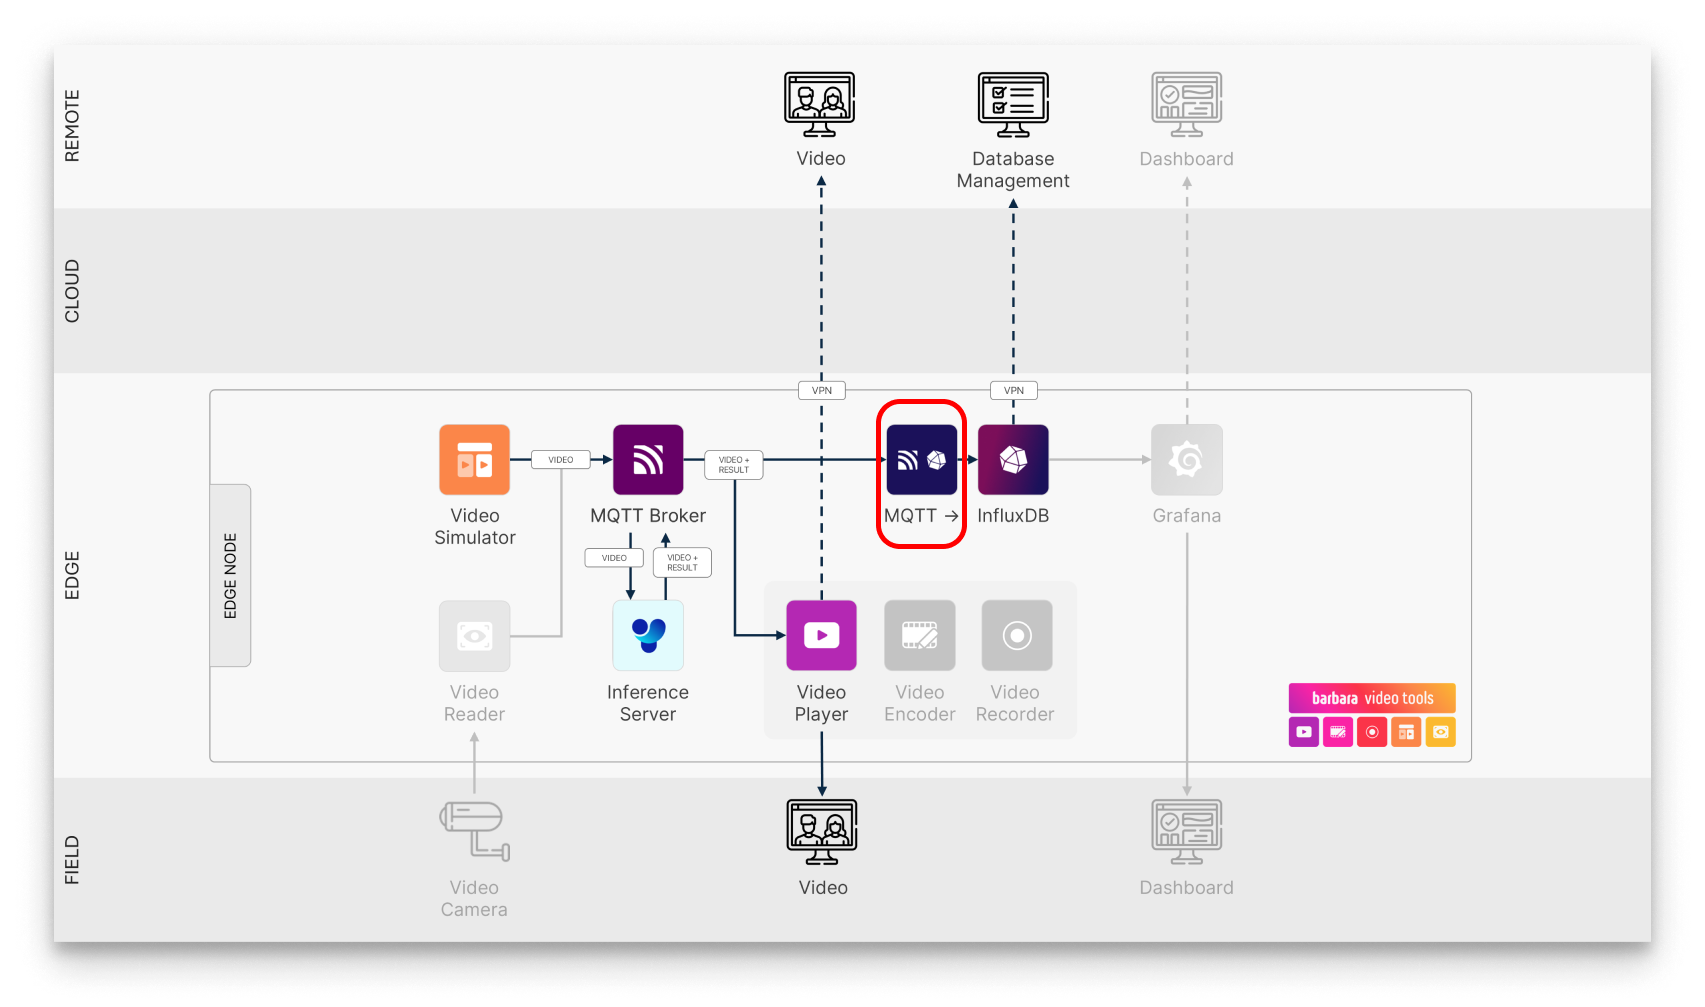
Ingester in the pipeline
Add the Ingester to your Library


MQTT-InfluxDB Ingester
Service that extracts data from the MQTT Broker and writes it to the InfluxDB database.
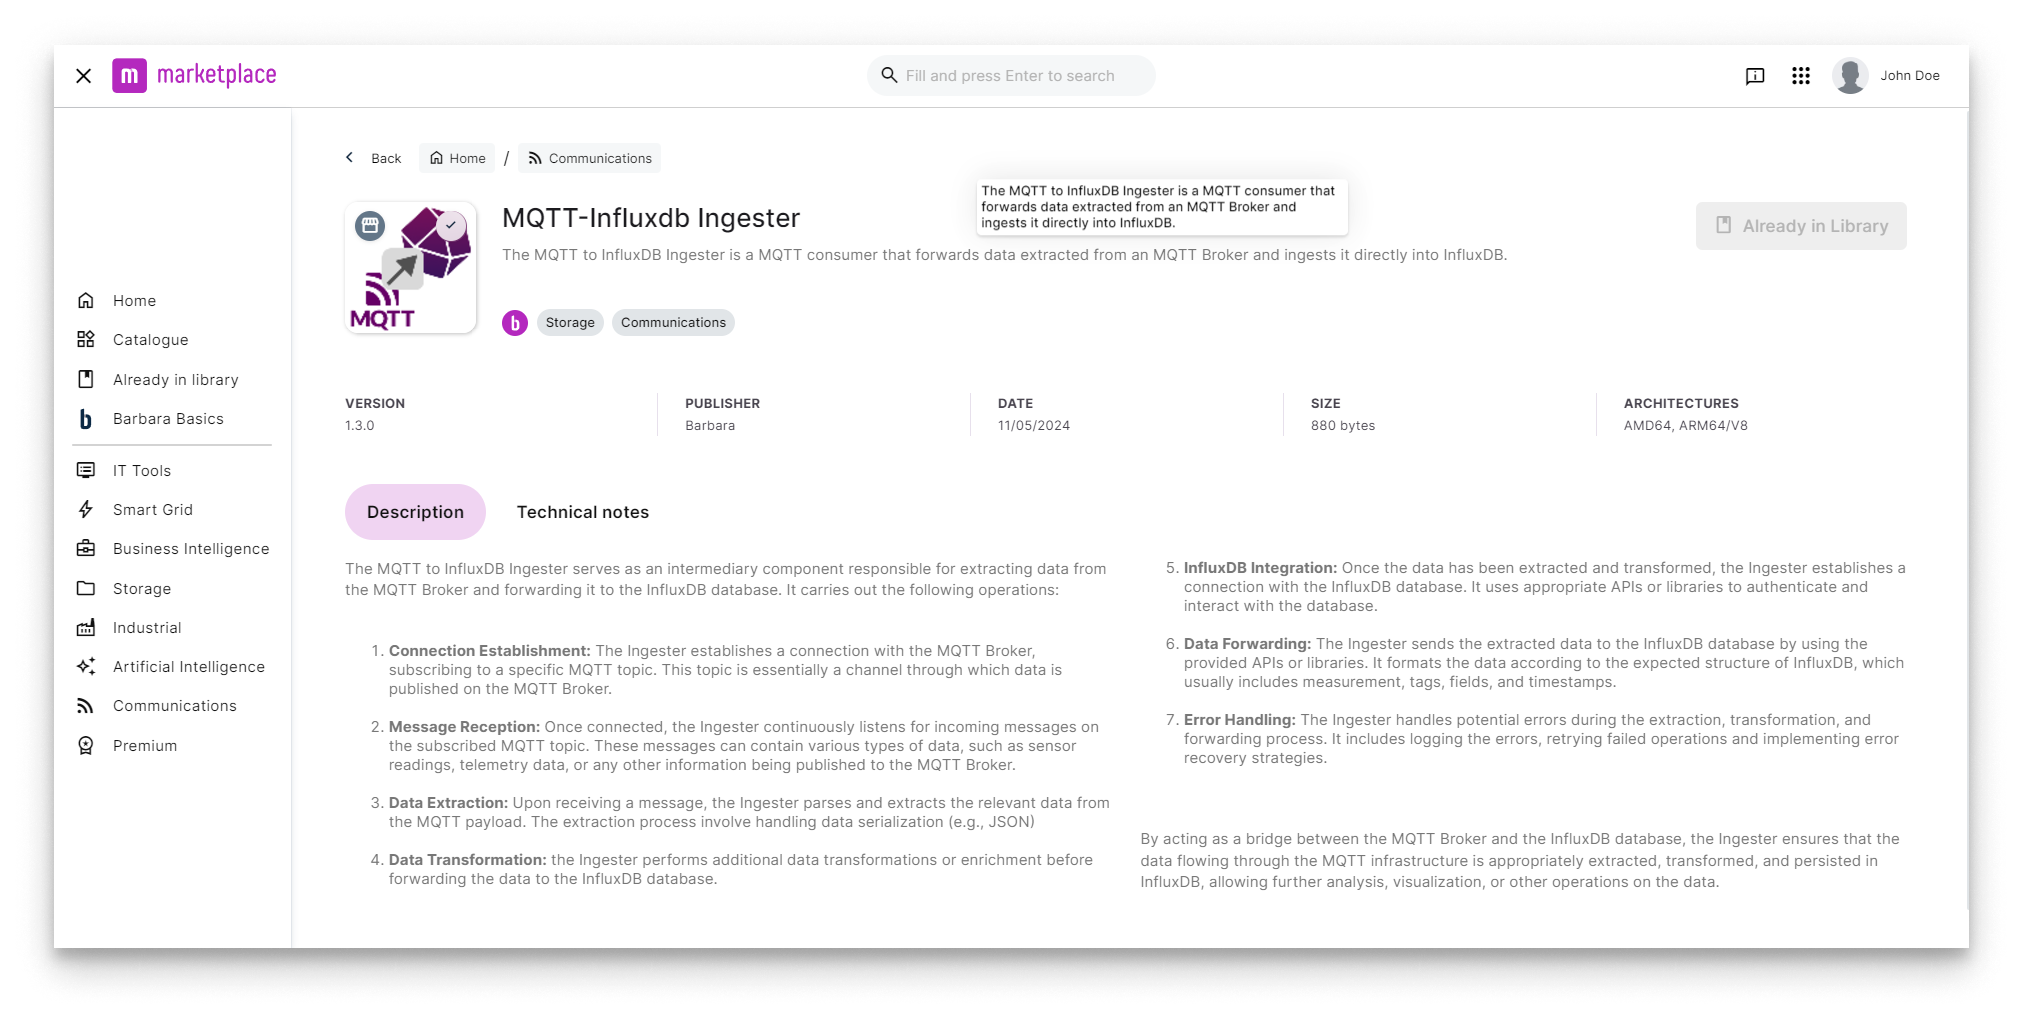
Ingester in the Marketplace
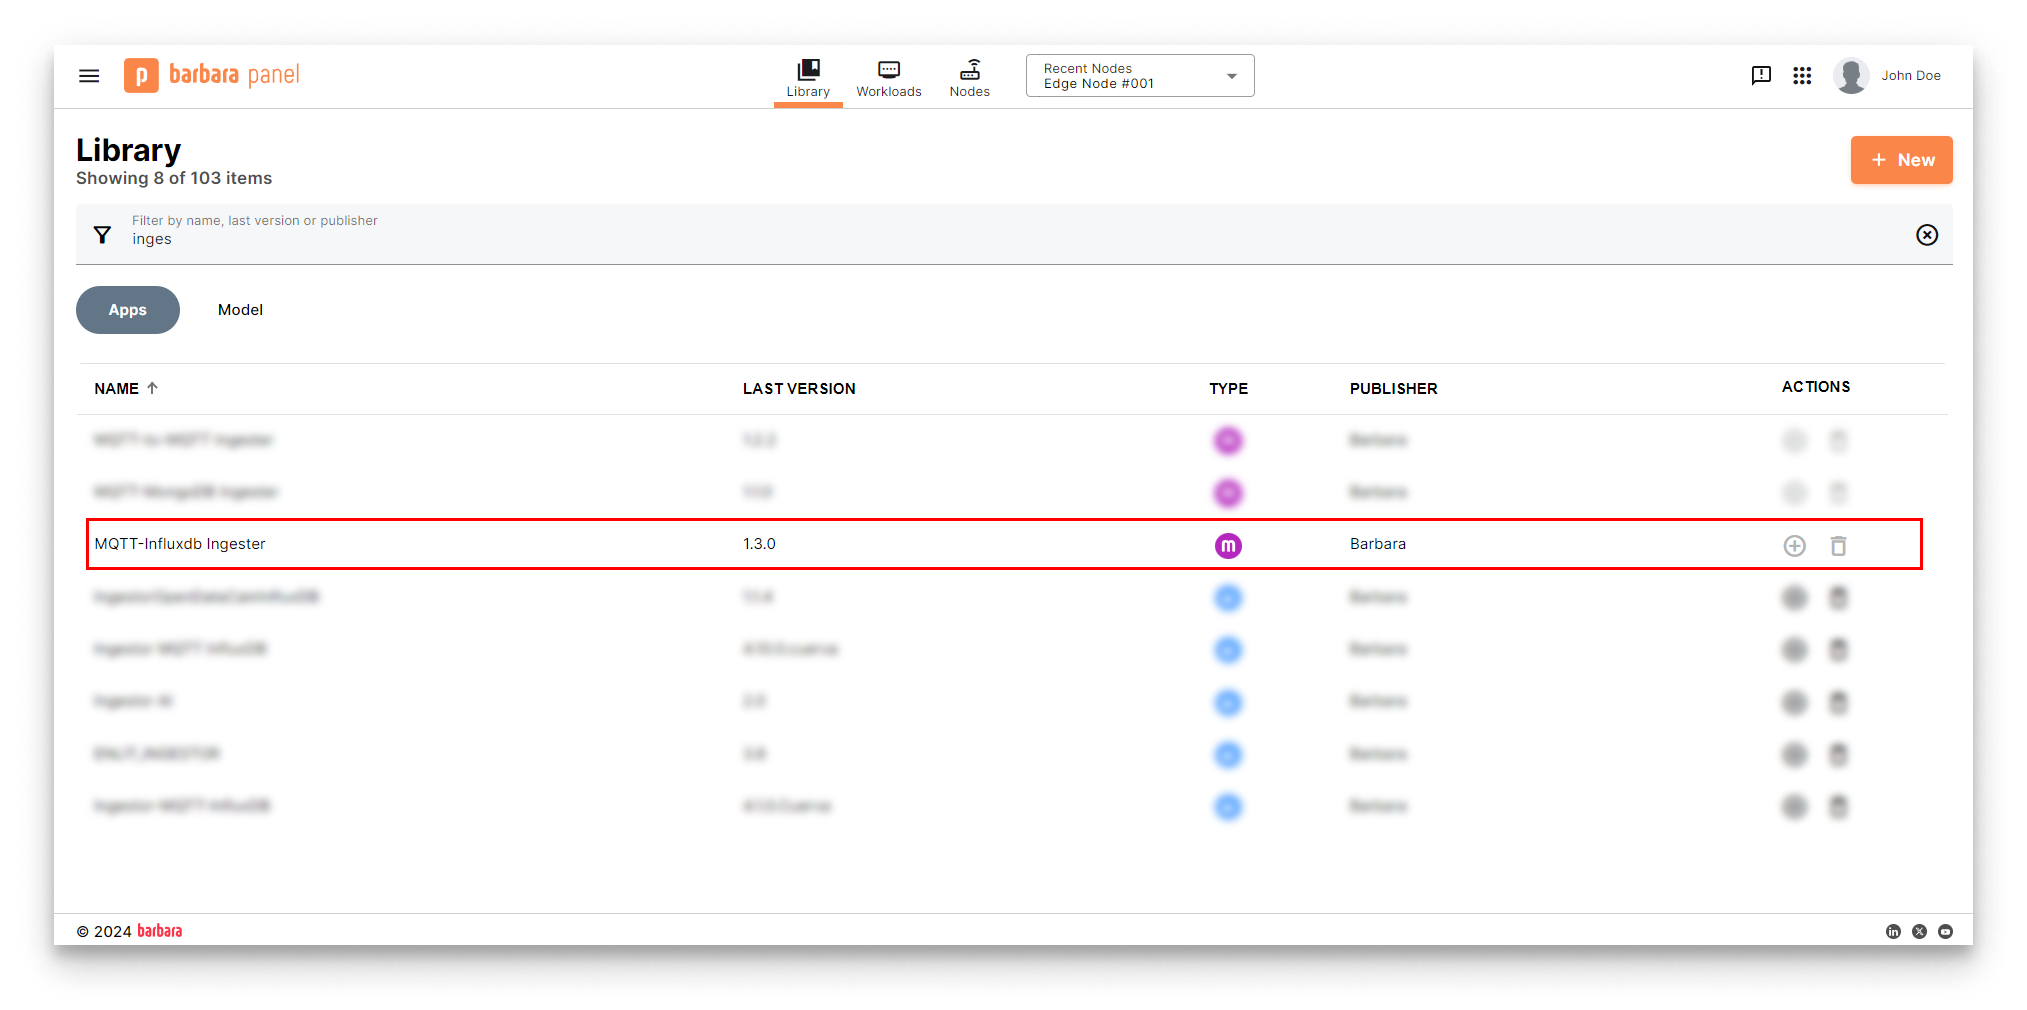
Ingester in the App Library
Deploy the Ingester
- Open the Node Details page and click Add card → Application.
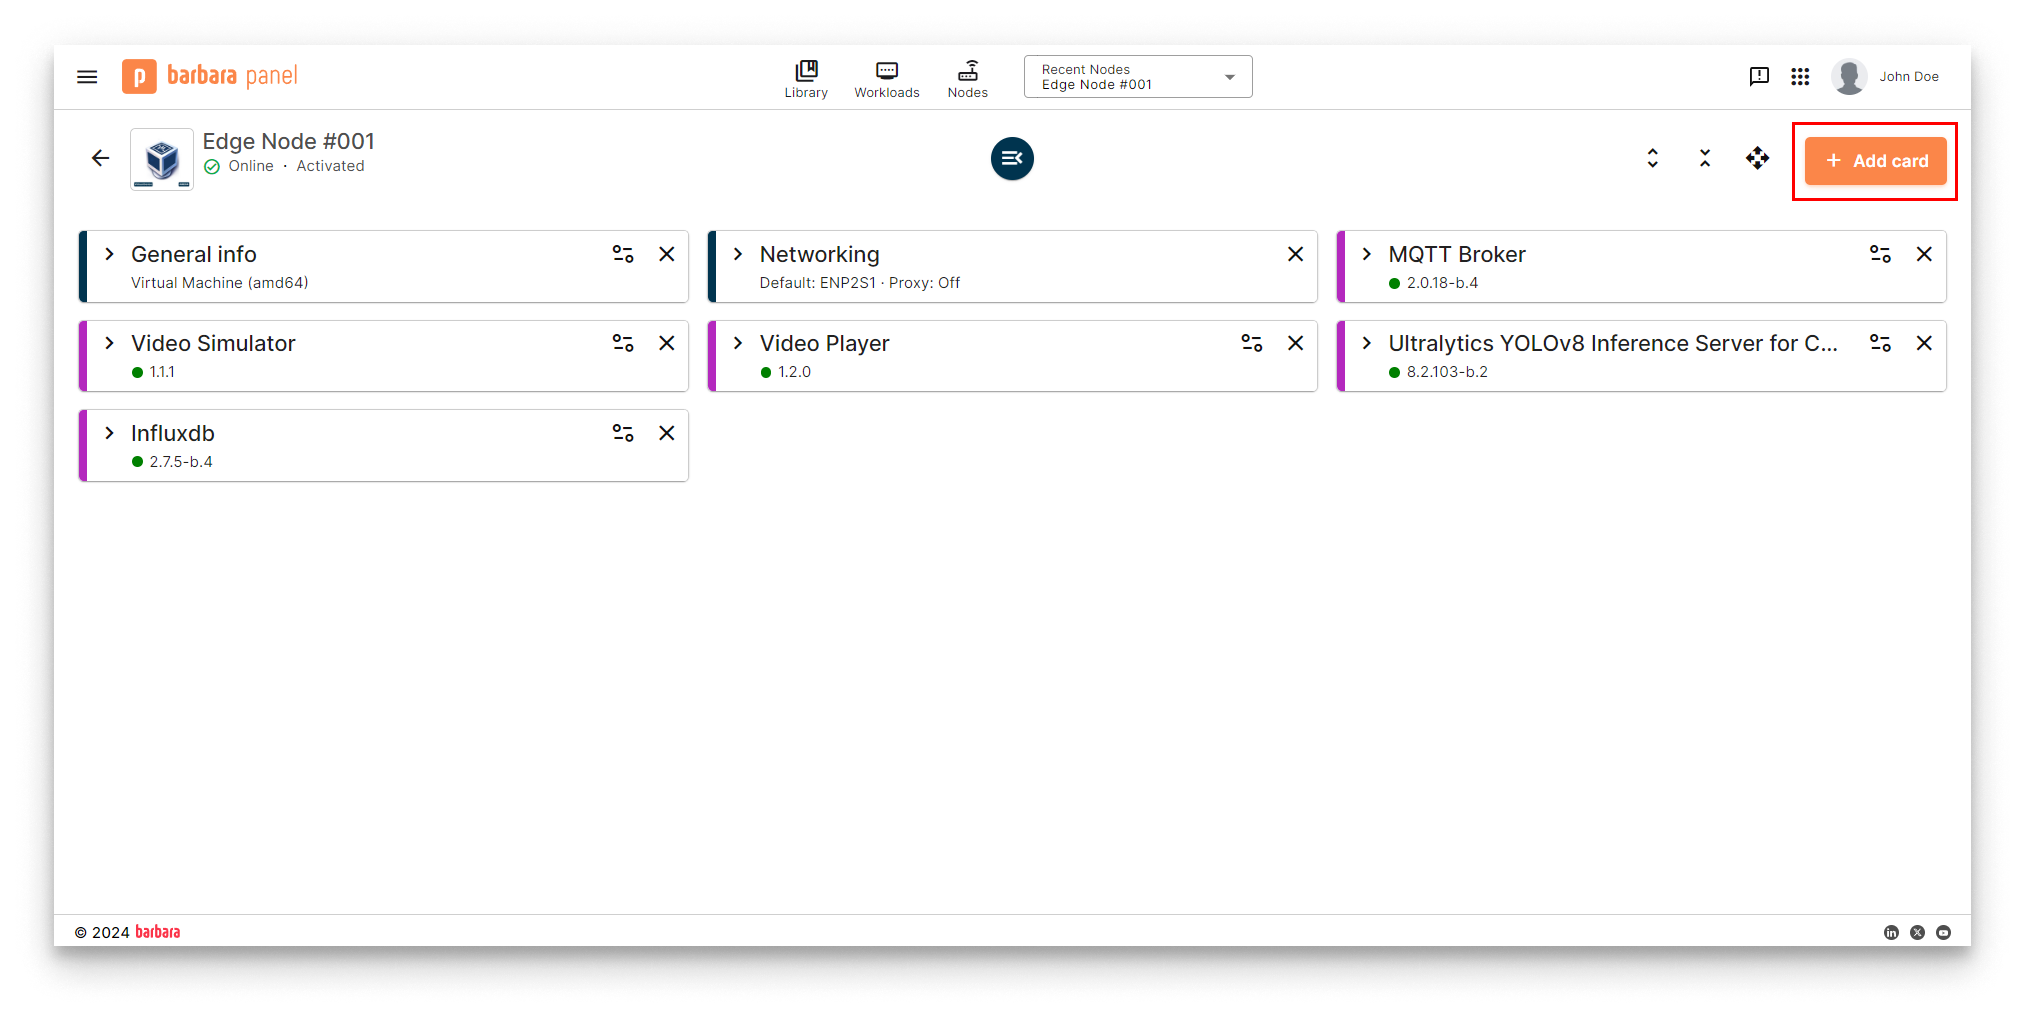
Add card menu
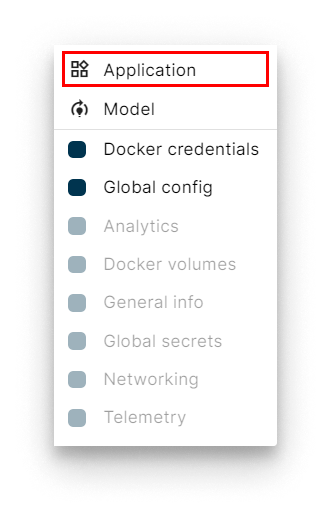
Select Application
- Select app and version. Pick MQTT-InfluxDB Ingester and its latest version. Click Next.
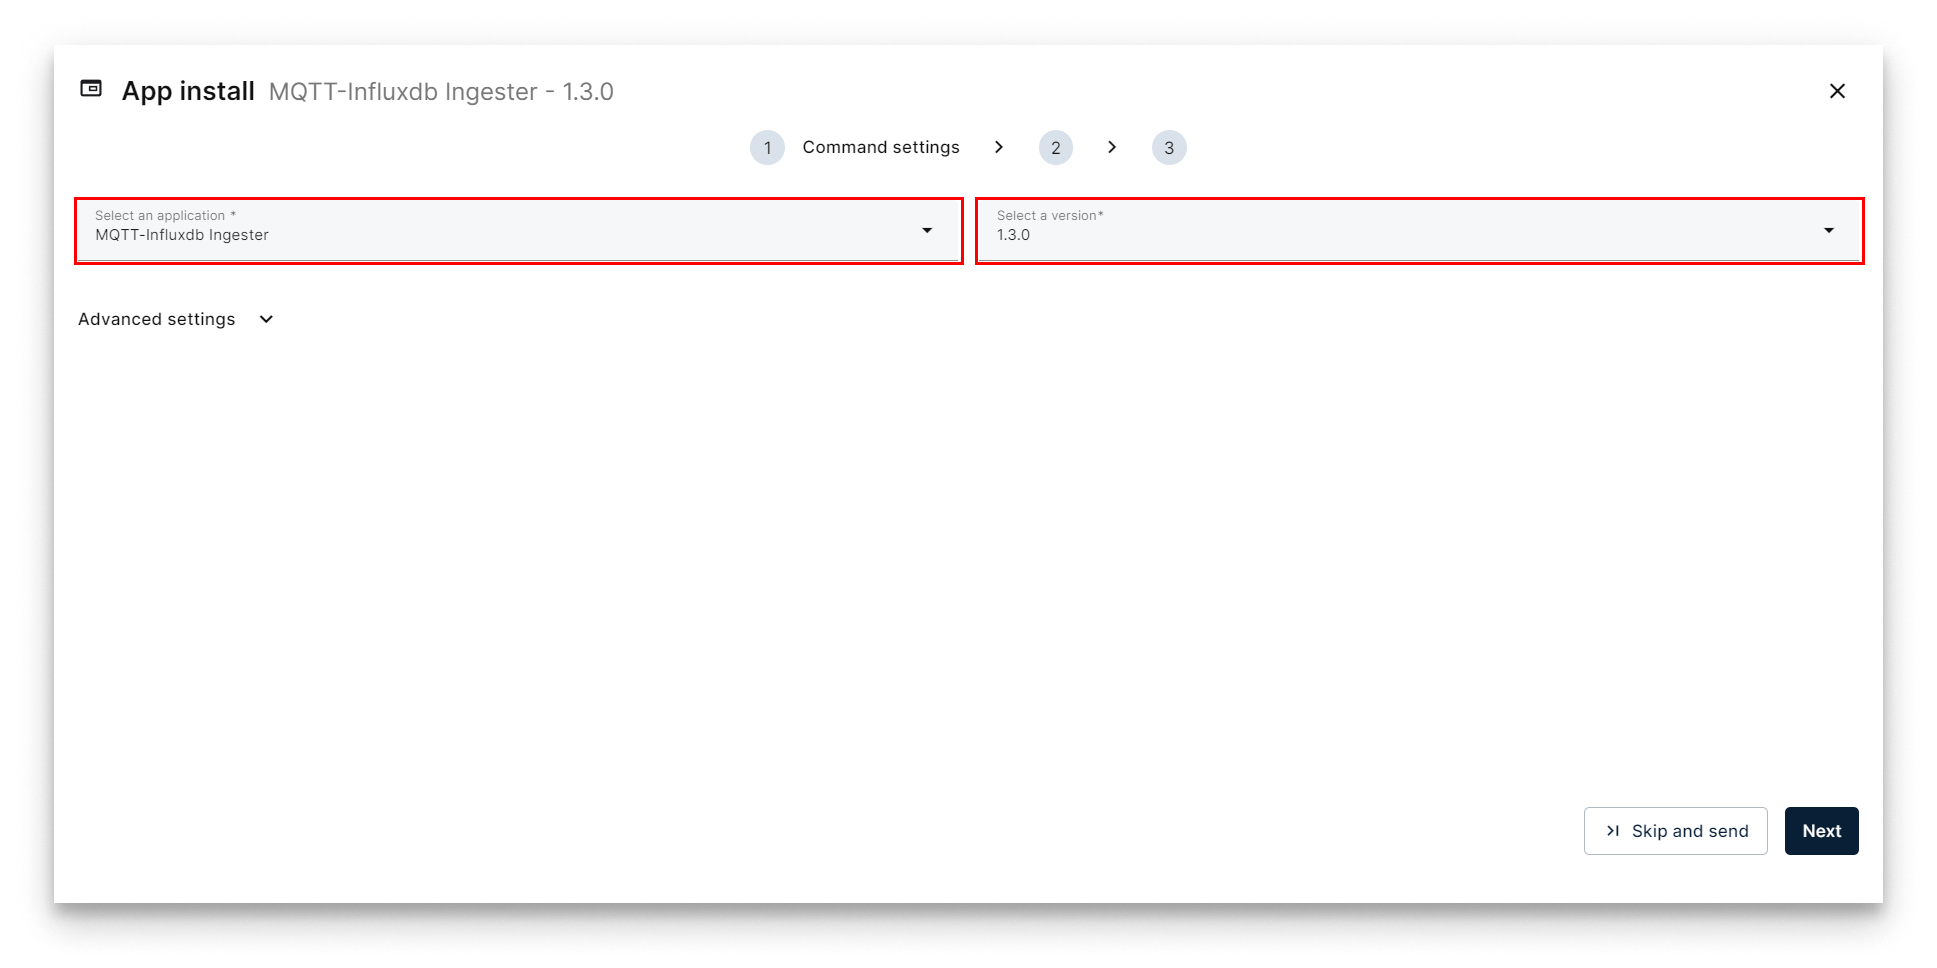
Select Ingester
- App Secrets. Keep the defaults and click Next.
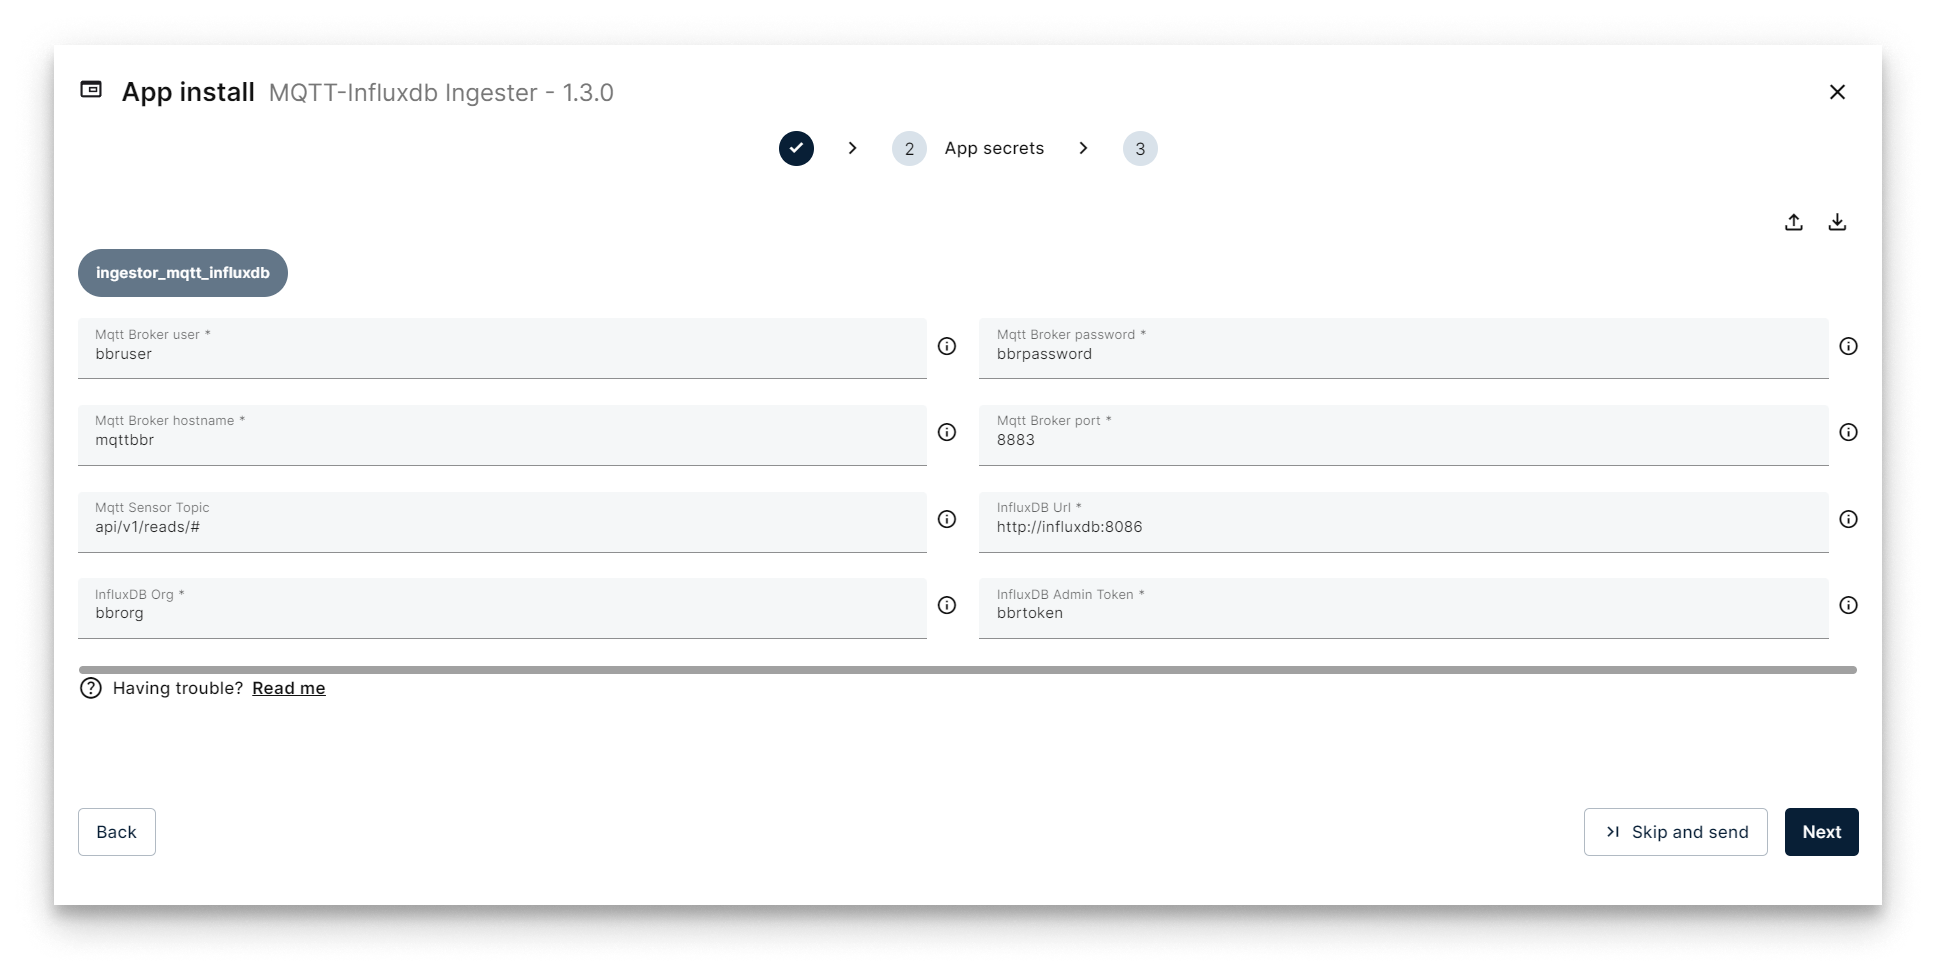
App Secrets for the Ingester
-
App Config. Paste the JSON below —
deviceDisplayNamemust matchdisplayNameTelemetryfrom the YOLOv8 App Config (yolov8_telemetry_01).{
"ingestorMqttInfluxdb": {
"inputs": [
{
"bucketInflux": "bbrbucket",
"dataFields": [],
"dataTags": [],
"deviceDisplayName": "yolov8_telemetry_01",
"deviceNameInflux": "yolov8_telemetry_01",
"deviceTags": [],
"measurementInflux": "yolov8_telemetry",
"subDeviceTags": [],
"tags": "",
"type": "read",
"userTags": []
}
],
"system": {
"bucketAutoCreate": true,
"bucketAutoCreateRetention": 3600,
"debugLevel": "info",
"forceType": false
}
}
}Key fields:
Section Parameter Value Description inputsbucketInfluxbbrbucketInfluxDB bucket to write into. inputsdeviceDisplayNameyolov8_telemetry_01MQTT stream to read — the telemetry stream YOLOv8 publishes to. inputsdeviceNameInfluxyolov8_telemetry_01Device identifier inside the InfluxDB measurement. inputsmeasurementInfluxyolov8_telemetryInfluxDB measurement that will hold the points. -
Click Send App.
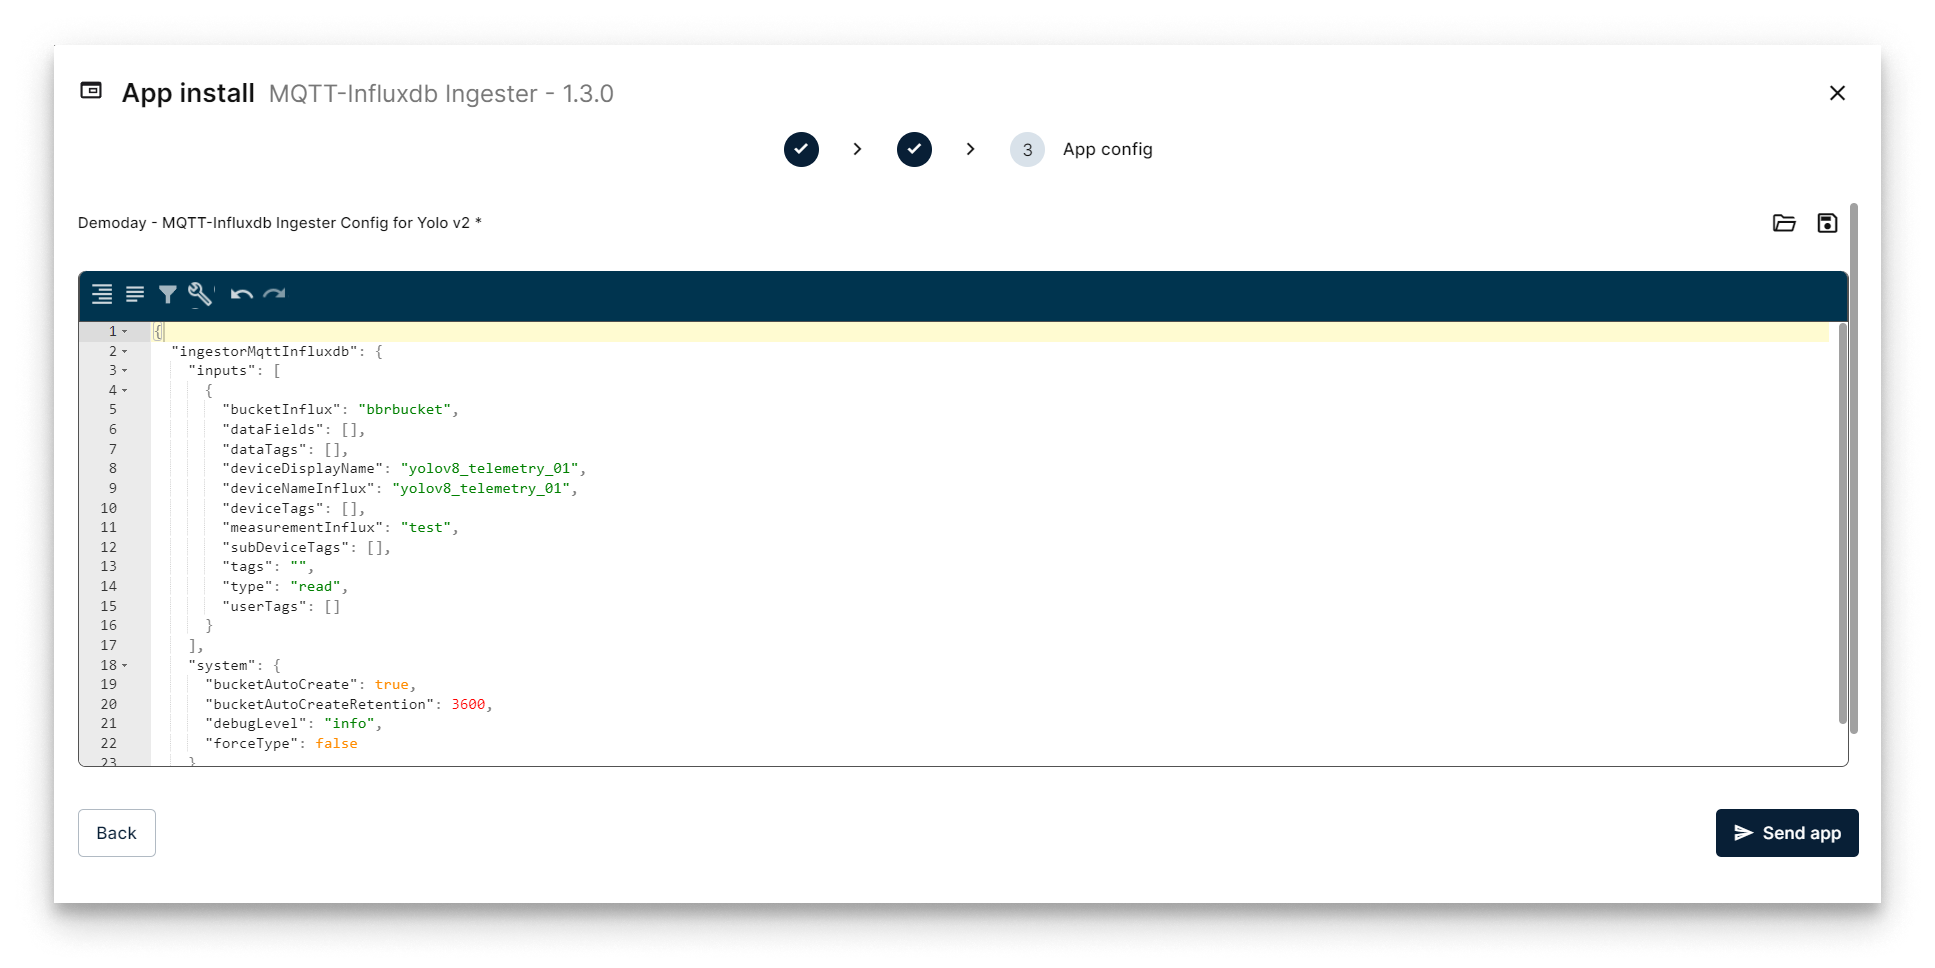
Send the Ingester deployment
Verify the deployment
The Ingester workload card appears on the Node Details page. When it turns green (Started), the bridge is up.
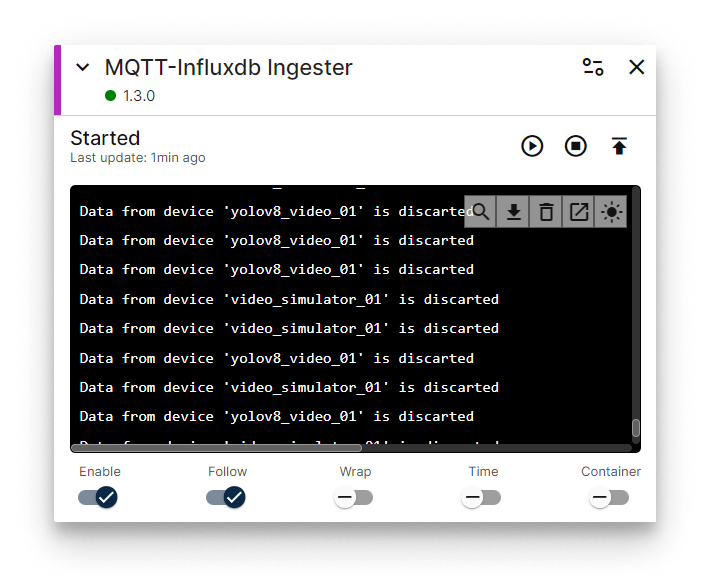
Ingester workload card
Confirm data lands in InfluxDB
-
Open the InfluxDB web UI at
http://<NODE_IP>:8086and log in.Parameter Default value Set in Port 8086Compose Config User bbruserApp Secrets Password bbrpasswordApp Secrets warningIf your laptop is on a different network than the node, enable the VPN and use the node's VPN IP instead.
-
Open Data Explorer from the side menu and build a query against the
bbrbucketbucket and theyolov8_telemetrymeasurement.
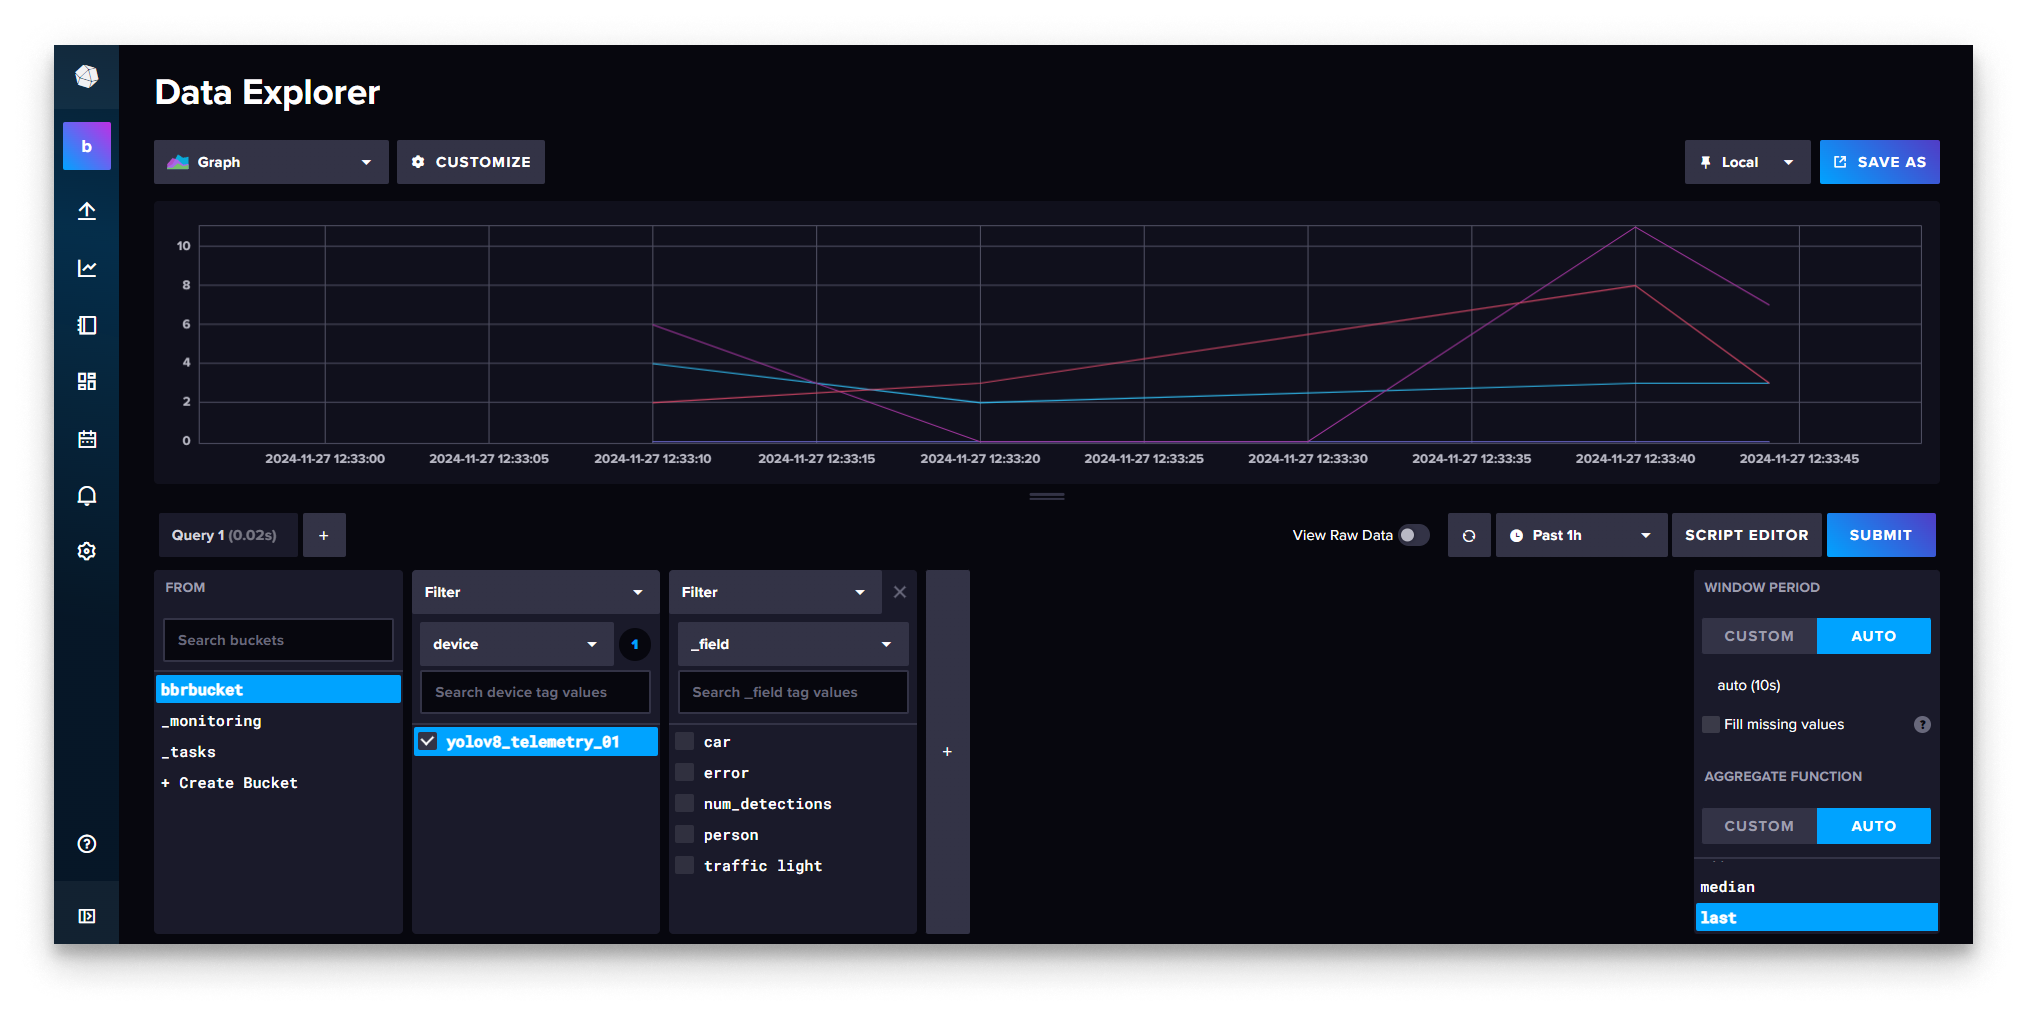
InfluxDB Data Explorer
Points appear as YOLOv8 keeps publishing new telemetry messages — the bridge is working.
Summary
The Ingester closes the loop between MQTT and InfluxDB: every YOLOv8 telemetry message now lands as a point in the bbrbucket bucket under the yolov8_telemetry measurement, ready for Grafana to chart in Step 7.