3.3 - Deploy Grafana and create a dashboard
This article refers to Platform v3.2.0. The current Platform version is v3.3.0.
Overview
In this final step, you'll deploy a dashboard on your edge node to visualize all the data collected throughout the quickstart guide. Dashboards are great because they offer a clear, centralized way to monitor and analyze real-time data from various sources. Specifically, you will use Grafana.
Grafana is an open-source observability and data visualization platform used to build interactive dashboards and monitor real-time data from multiple sources.


Grafana
Data visualization platform that allows users to create interactive panels and graphs to analyze real-time data.
Go to the official website: grafana.com.
Add Grafana to the App Library
Search for Grafana in the Marketplace and click Add to Library. Alternatively, you can use the direct link provided above.
Once the application is listed in your App Library, it is ready to be deployed on your Edge Nodes.
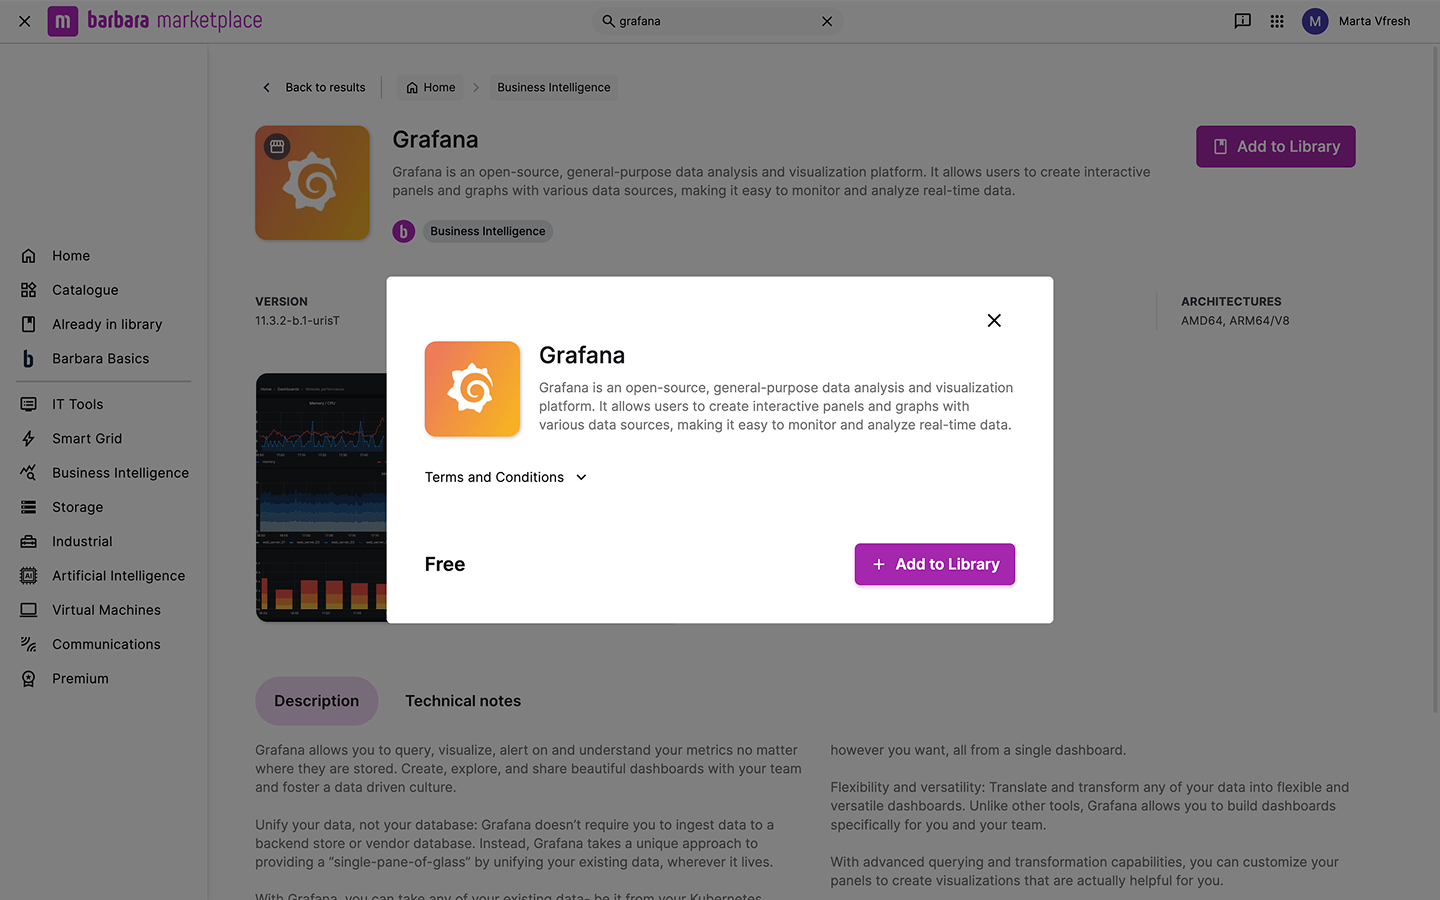
Grafana in Marketplace
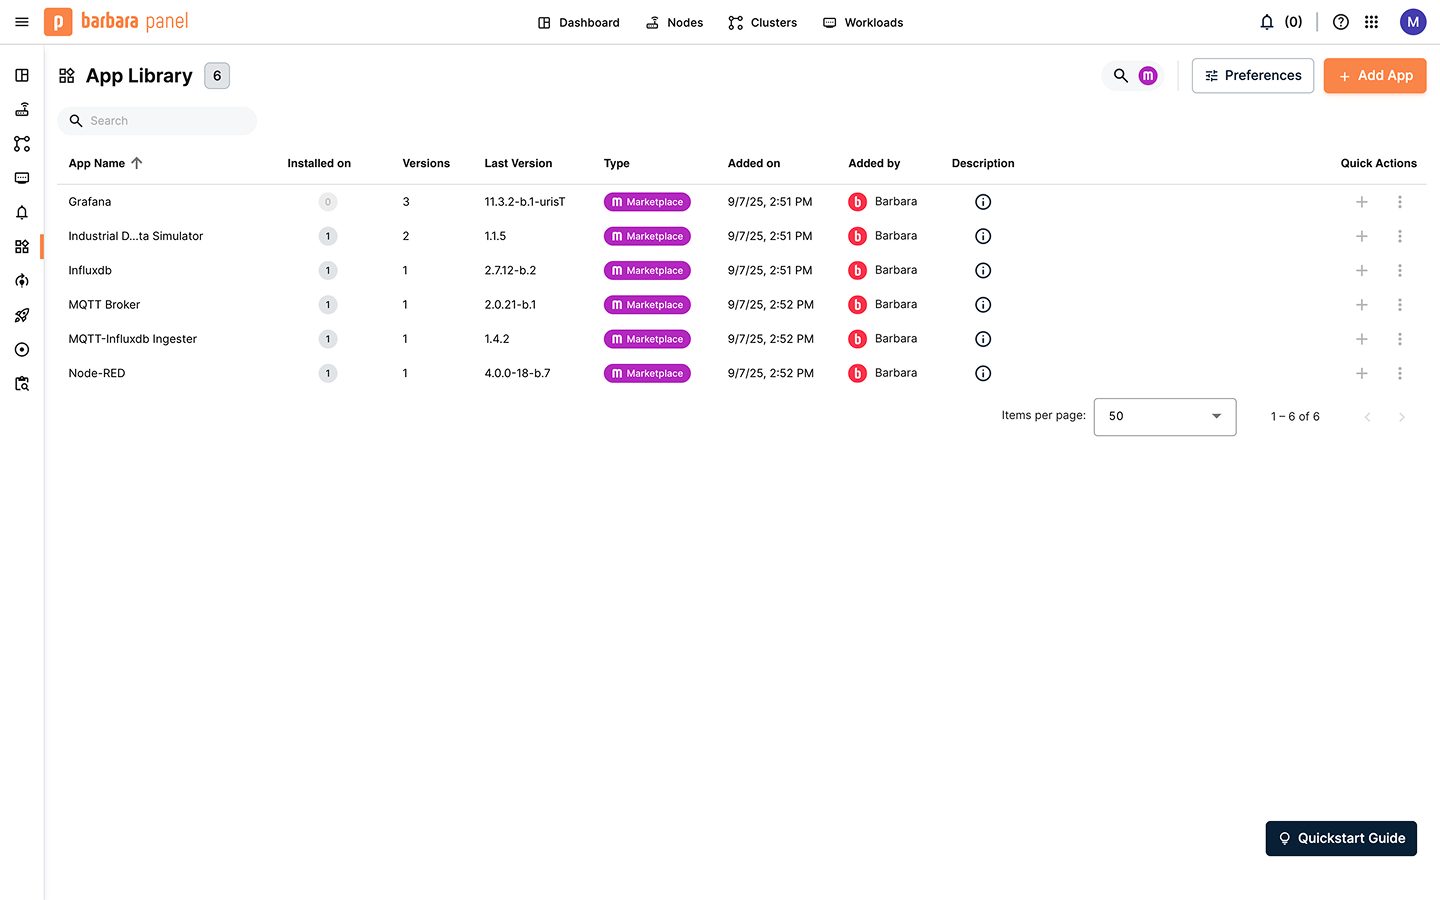
Grafana in the Application Library
Deploy Grafana in the Edge Node
To begin the deployment, open the Node Details page for the target edge node. Click the + Add button and choose Application to launch the deployment wizard. Complete the wizard as follows:
1) Select application
Choose Grafana and select the latest available version. Click Next.
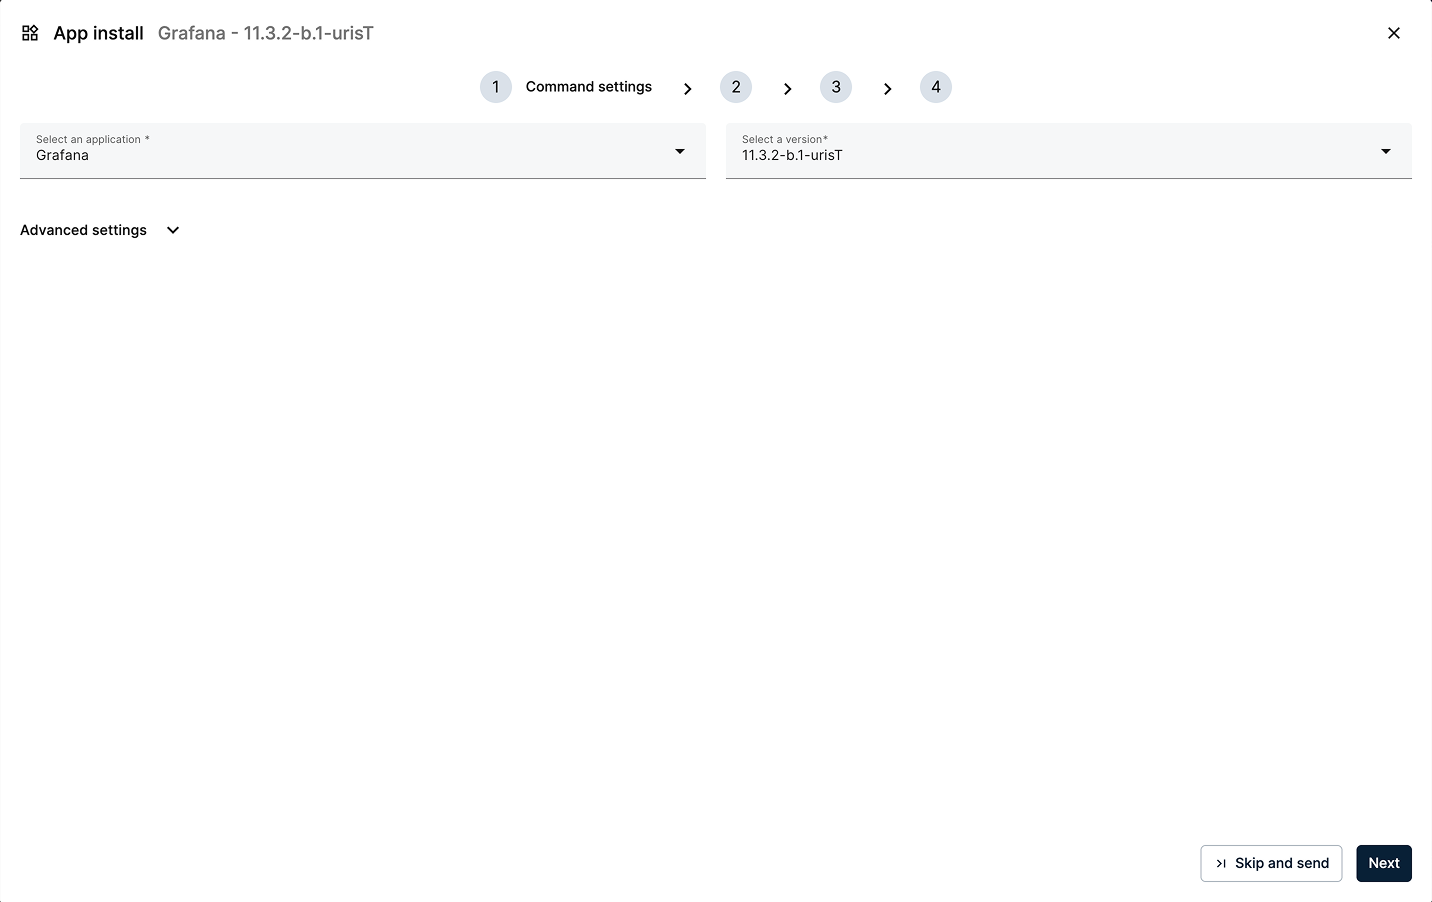
Select Grafana and the latest version
2) App Secrets
Review the application secrets, which include the default username and password for Grafana. For this tutorial, keep the default values and click Next.
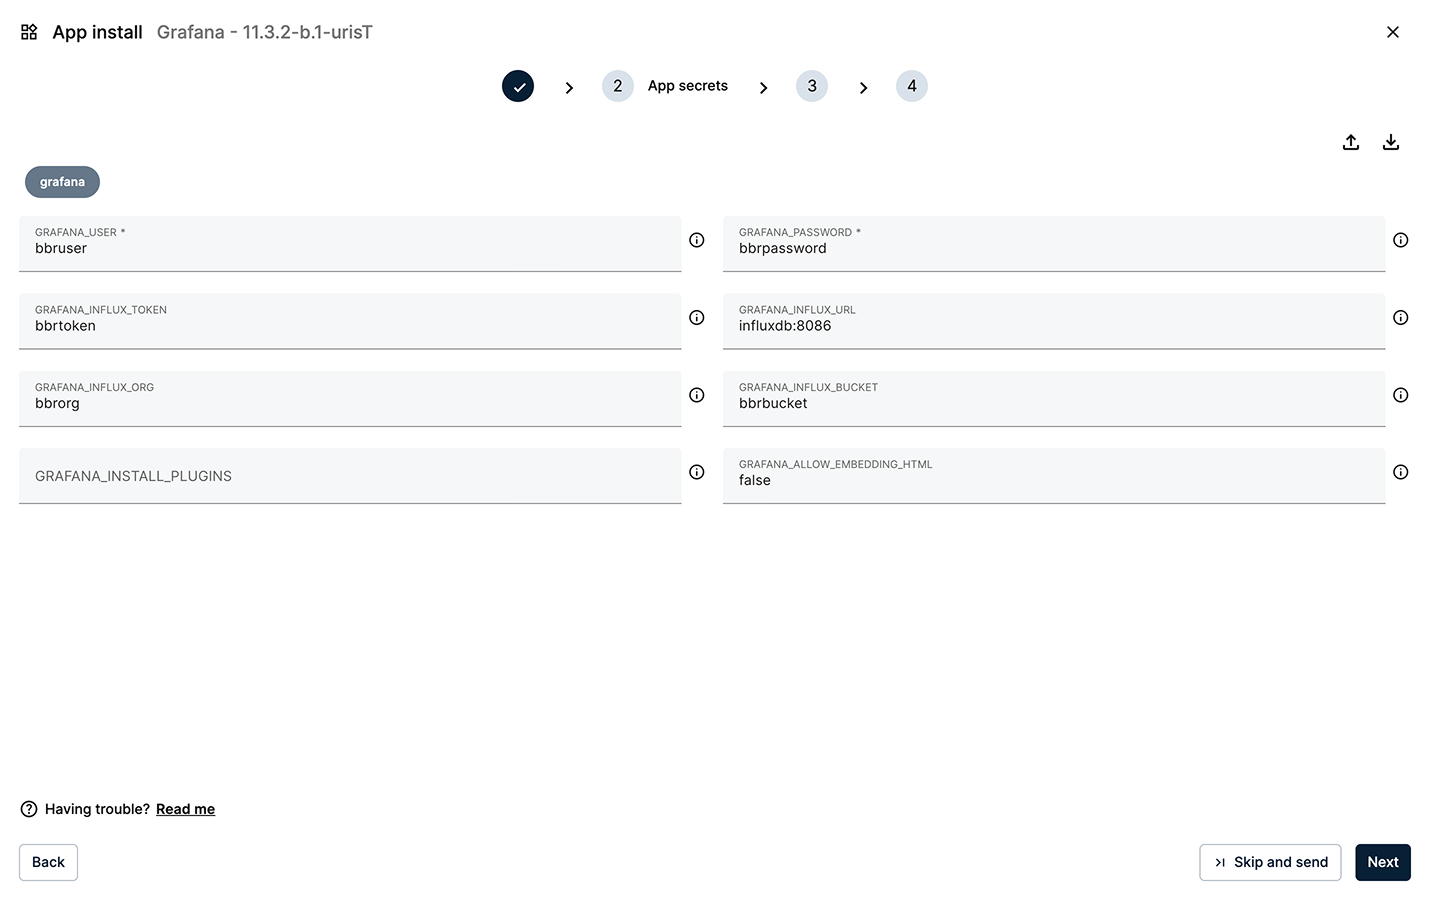
Keep the default values for the App secrets
3) Compose Config
Define ports and volumes for the container. Leave the default values and click Next.
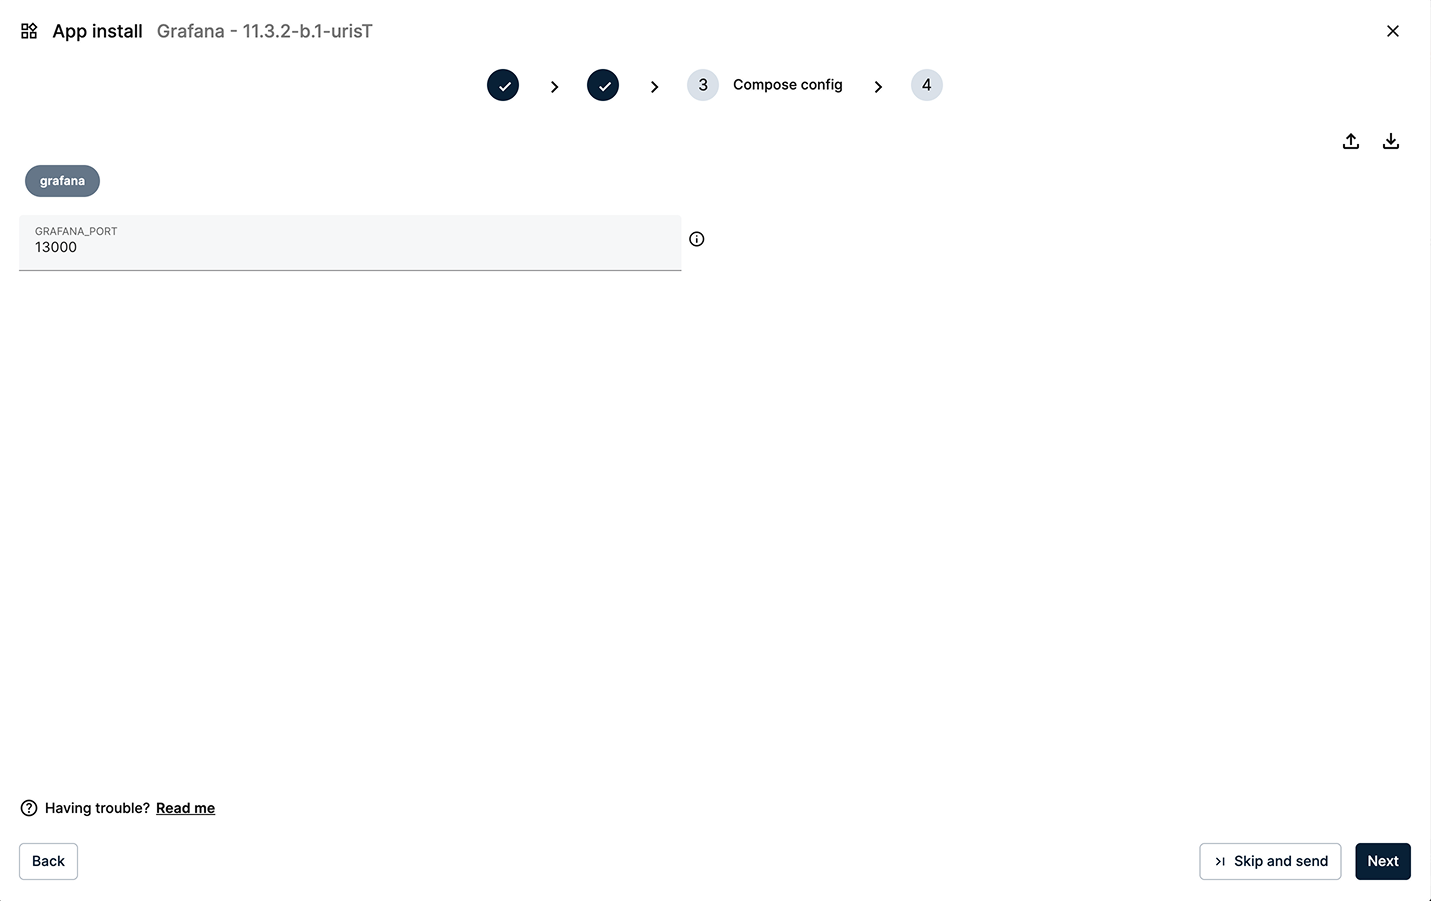
SKeep the default values for the Compose Config
4) App Config (optional dashboard)
You can preload a dashboard so it's instantly available on first launch. Download the file below and paste its JSON content into the editor. Then click Send App.
You can download the configuration file from here: app_config_grafana.json.
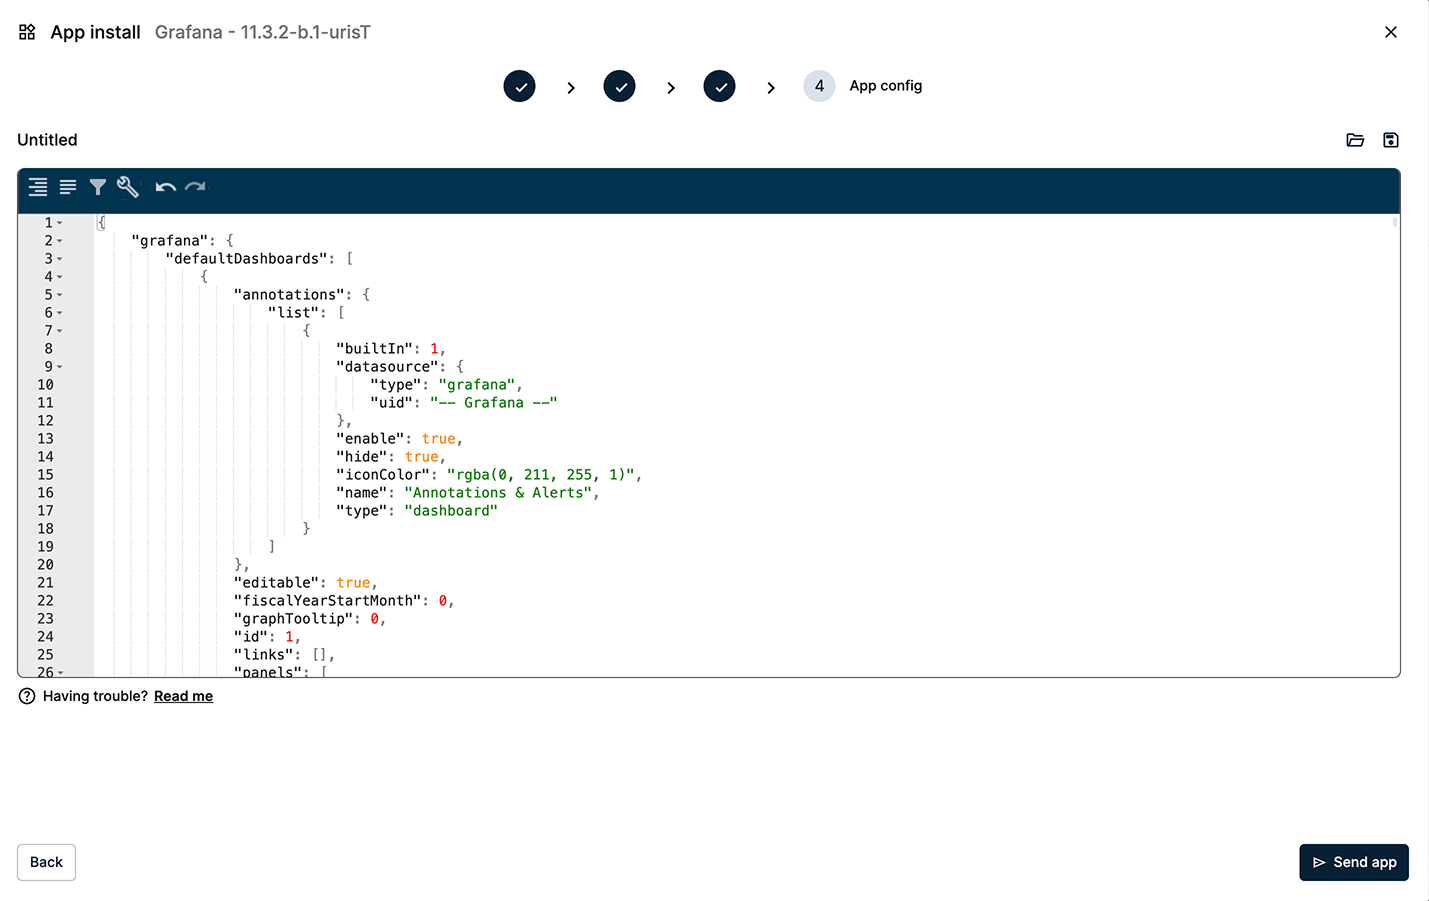
Paste the data for the predefined dashboard in the App Config editor
Within a few seconds, a new Grafana card will appear in the Apps & Models section of the node, indicating a successful deployment.
Accessing the Grafana Dashboard
Open a new browser tab and navigate to http://[EDGE_NODE_IP]:13000 to reach Grafana's login page.
Sign in with the default credentials:
- user:
bbruser - password:
bbrpassword
These credentials are set in the App Secrets (Step 1.2) and can be changed just like you configured Node-RED in Step 1.3.
You can find a complete list of configuration options in the app's Technical Notes in the Marketplace.
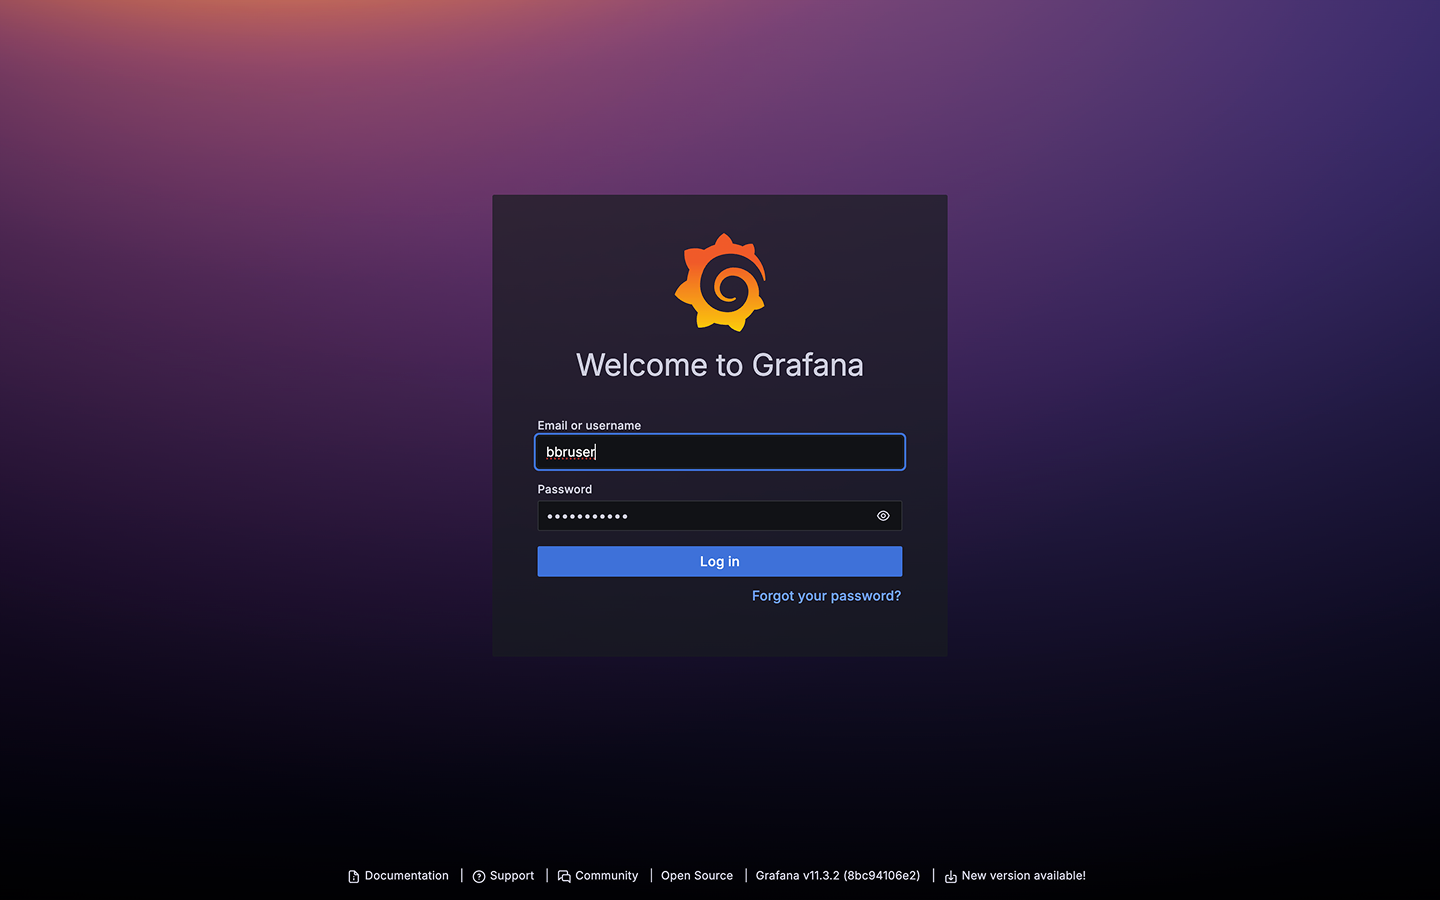
Grafana login page
After authentication, you will land on the visualization dashboard. The predefined dashboard includes panels for the CNC01 machine, showing telemetry from both the Industrial Data Simulator and Node-RED. It highlights key performance indicators for OEE (Overall Equipment Effectiveness) calculations.
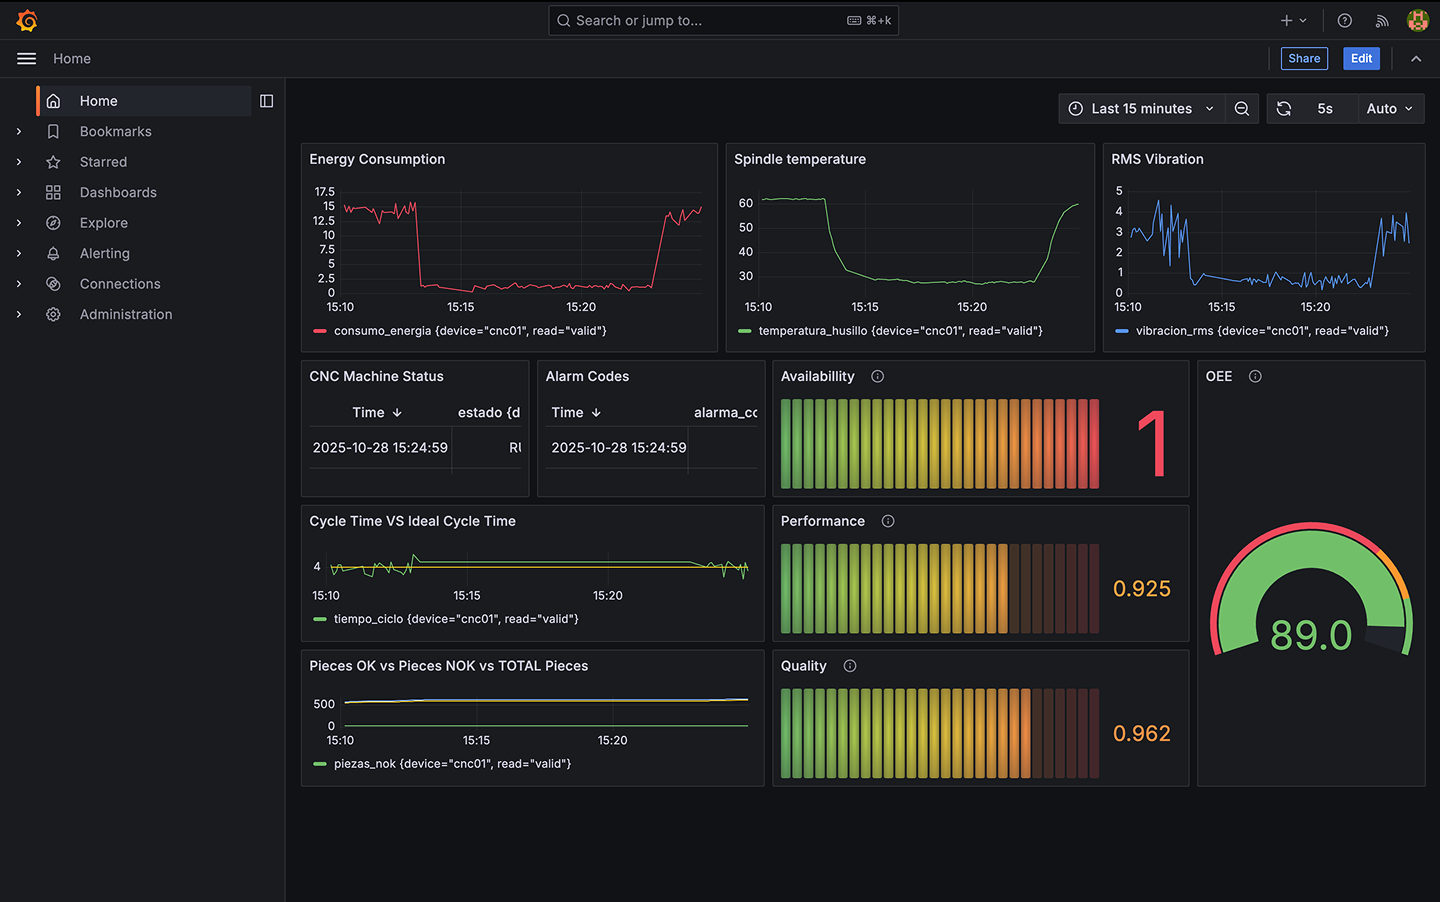
OEE Dashboard for the CNC Machine
Summary
In this step, you successfully completed the deployment of a full industrial data capture and processing pipeline based on the MING architecture (MQTT, InfluxDB, Node-RED, and Grafana). This simple example demonstrates what can be achieved easily at the edge using the Barbara platform.
This concludes the quickstart tutorial. Next, you can find some suggested exploration paths to continue getting familiarized with the platform.