Use the Alert Manager
This article refers to Platform v3.1.0. The current Platform version is v3.3.0.
Overview
The Alert Manager is a Marketplace application that watches a Barbara edge node and triggers alerts when something goes wrong. It covers three channels of monitoring:
- Service monitoring — periodic health checks of selected workloads on the node, with retries before triggering an alert.
- Telemetry monitoring — every 60 seconds it compares the node's resource usage (notably disk) against user-defined warning and critical thresholds.
- External variables — a REST endpoint that lets your own apps push values to be evaluated against alarm rules.
Alerts are dispatched as email to a configurable recipient list, optionally over MQTT to a broker on the same node, with an optional daily summary email.
Add the Alert Manager to your Library


Alert Manager
Watches services, telemetry, and external variables on an edge node and fires email or MQTT alerts when configured thresholds are breached.
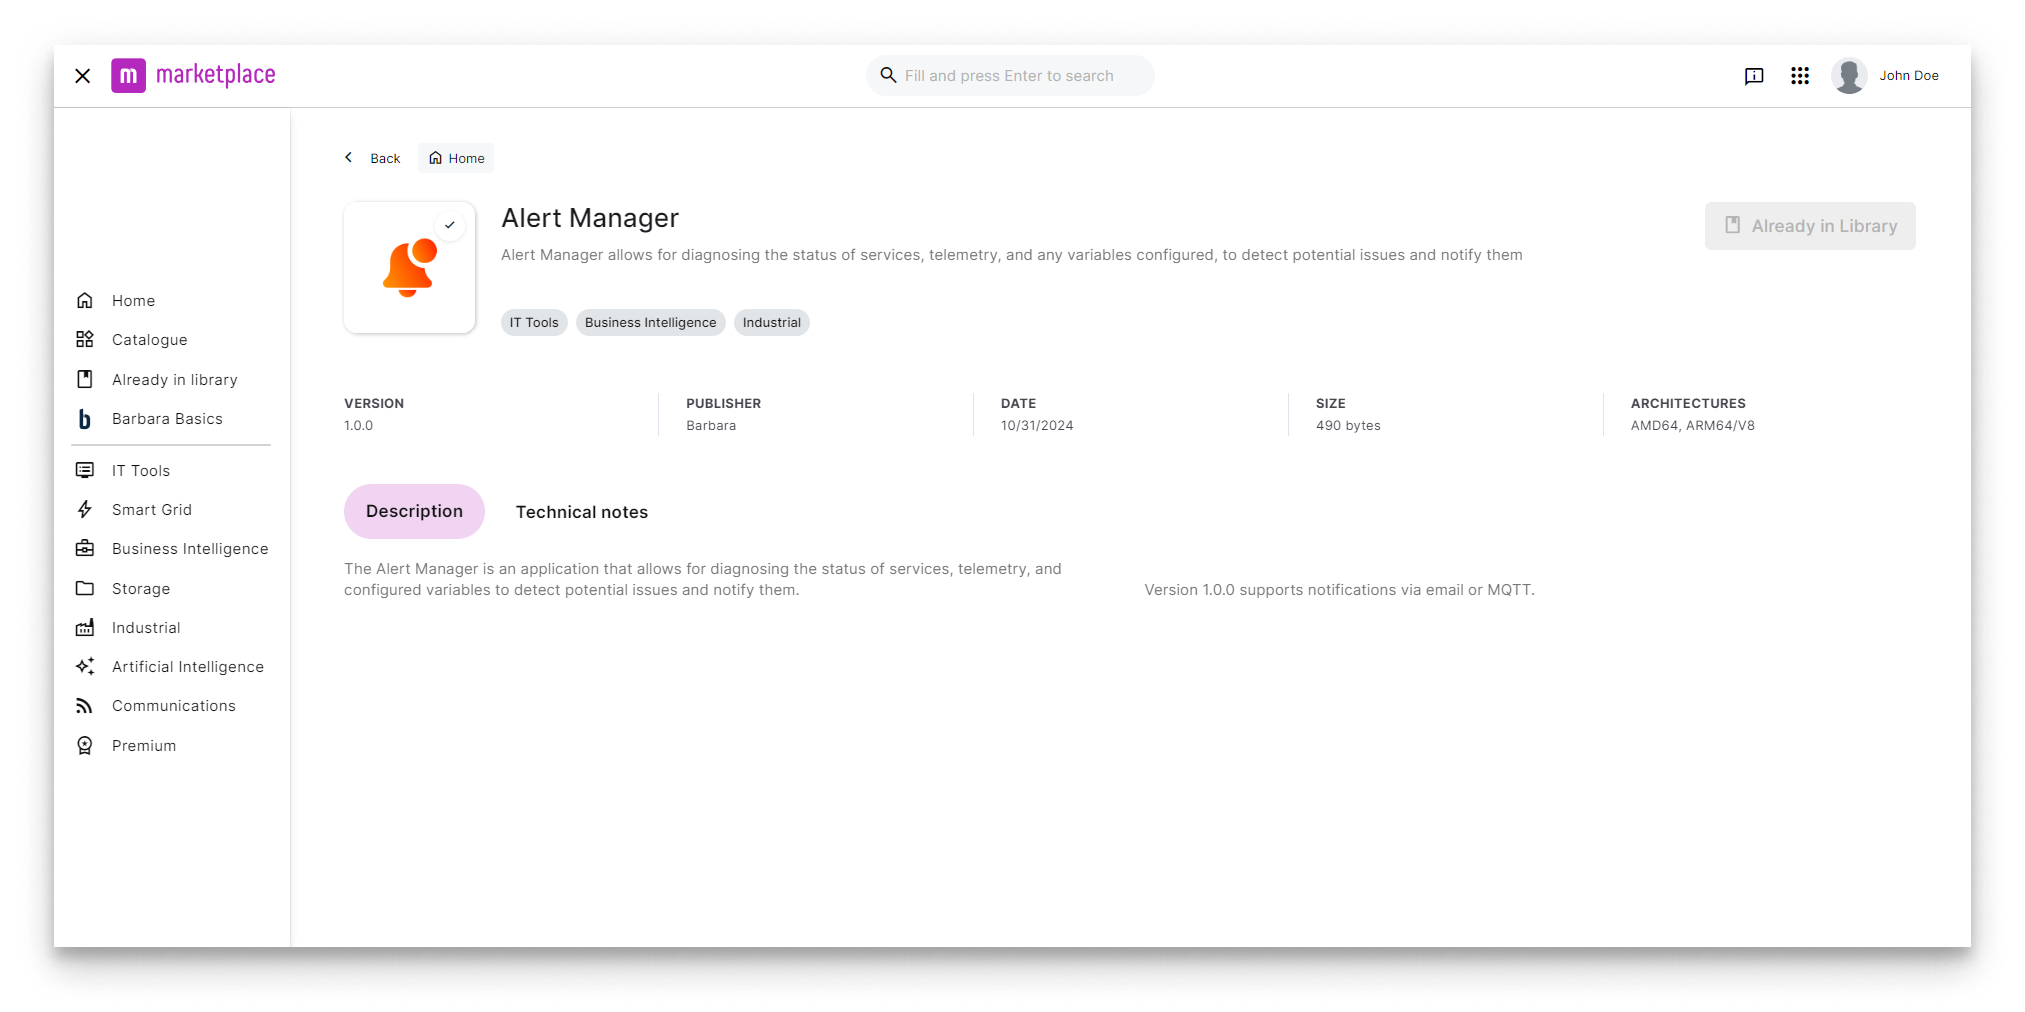
Alert Manager in the Marketplace
For the full Marketplace flow, see Add a Marketplace app to your Library.
Deploy and configure disk monitoring
On the Node Details page of the target node, click Add card → Application and pick Alert Manager to launch the install wizard.
App Secrets
The App Secrets carry the MQTT Broker credentials used when MQTT notifications are enabled. If you only want email alerts, leave the defaults — they are harmless when MQTT is off.
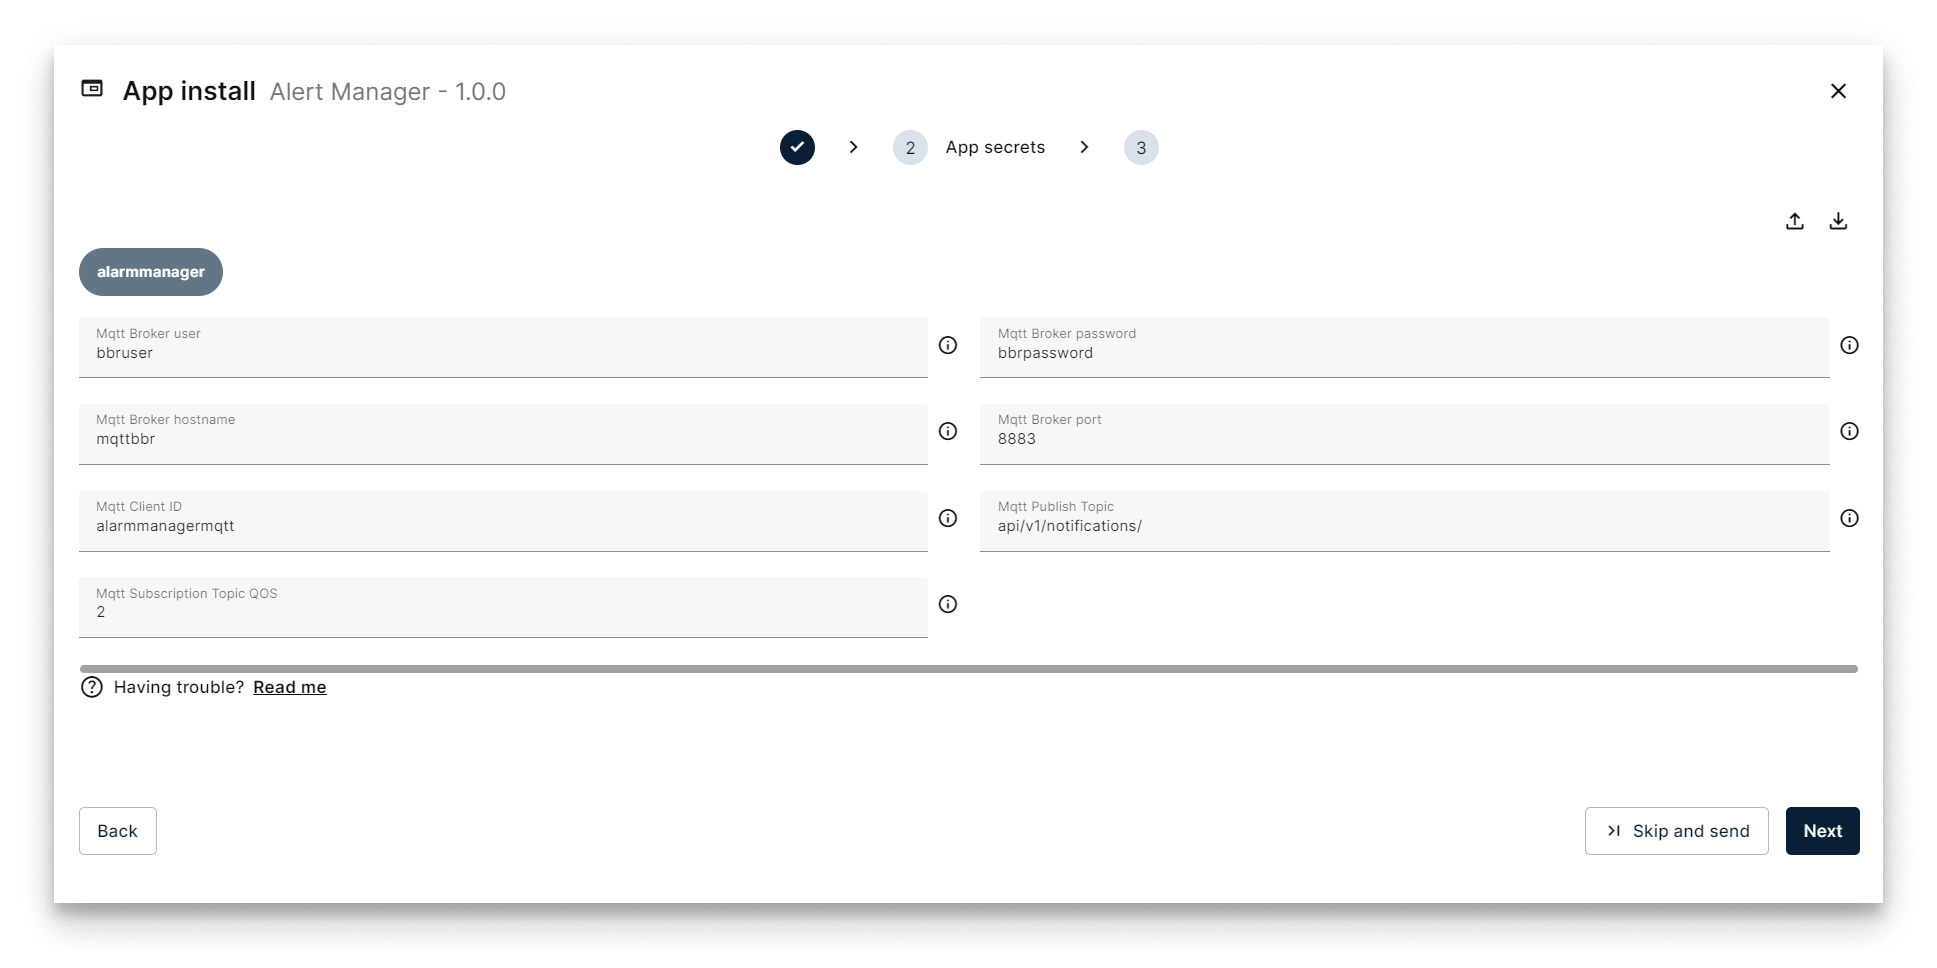
App Secrets in the install wizard
App Config — disk usage thresholds
Paste the following JSON in the App Config step to enable email alerts when disk usage crosses 75 % (warning) and 90 % (critical).
{
  "alarmmanager": {
    "debugLevel": "info",
    "notification": {
      "email_enabled": true,
      "email_recipients": ["user@company.tech"],
      "mqtt_enabled": false,
      "summary_enabled": false,
      "summary_time_utc": "09:00"
    },
    "telemetry": {
      "disk_alarm_warning_threshold": 75,
      "disk_alarm_critical_threshold": 90
    },
    "services": []
  }
}
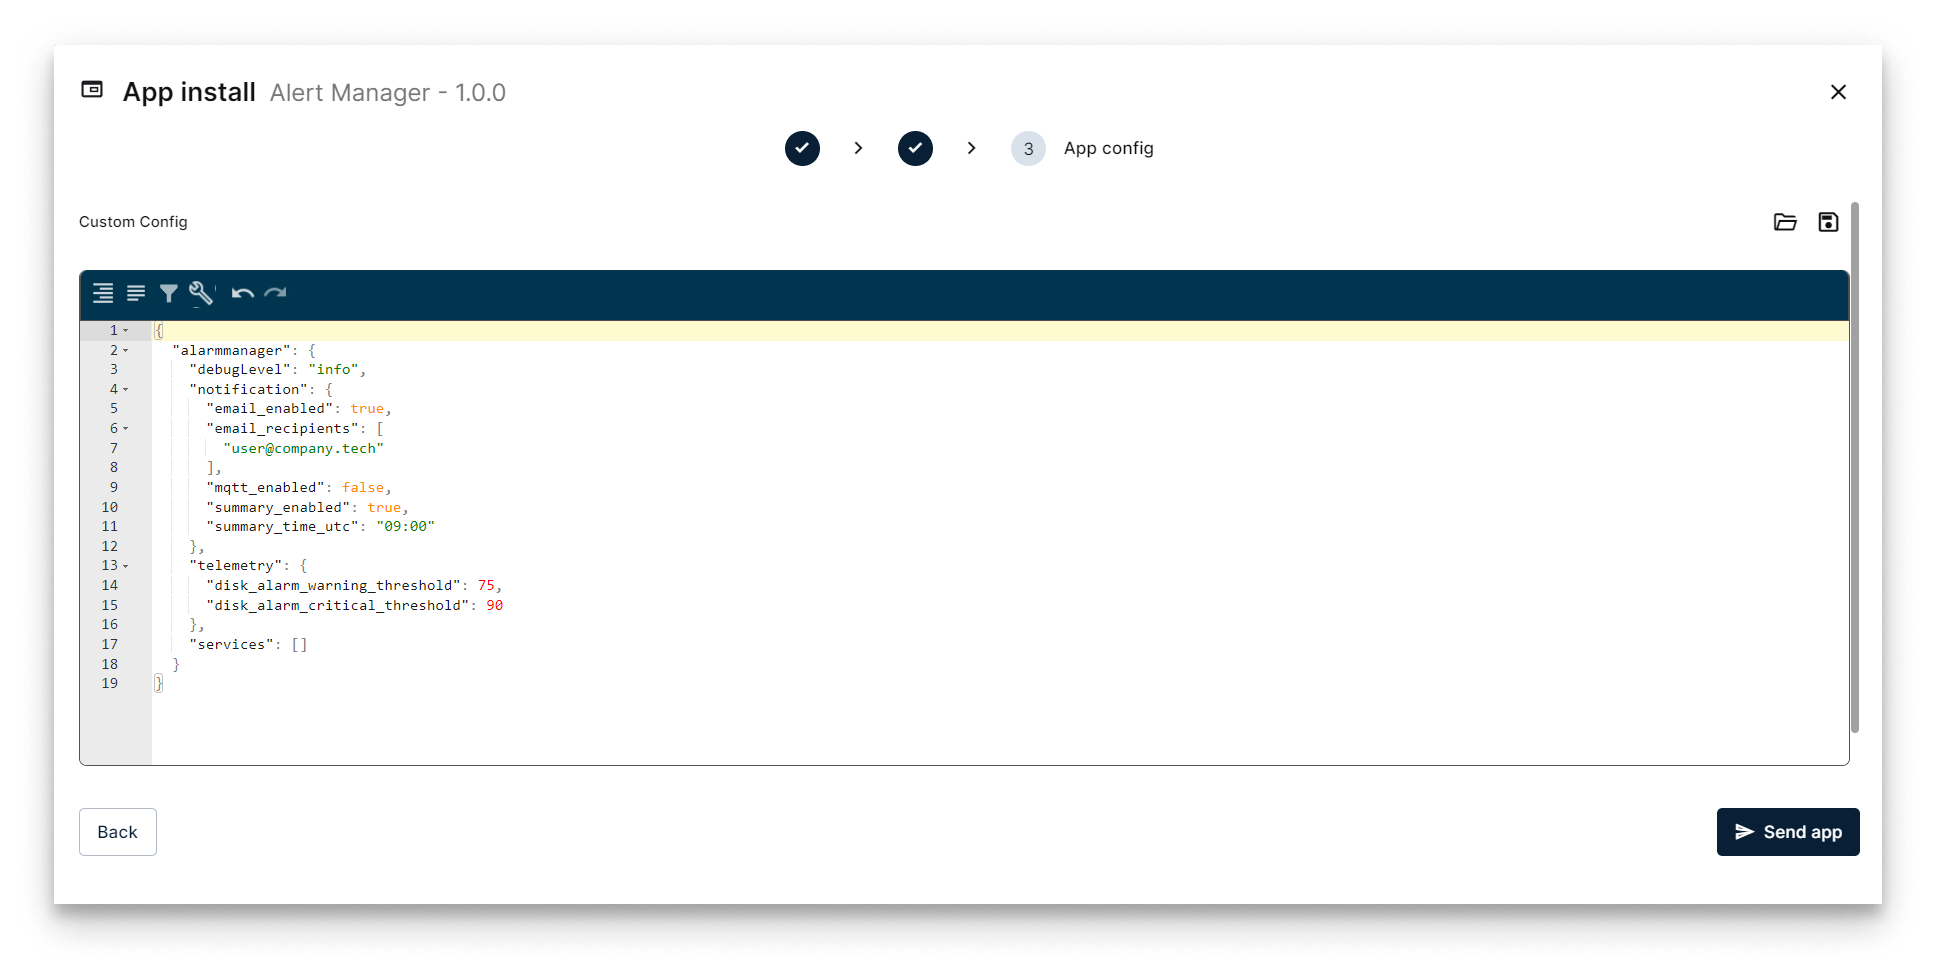
App Config in the install wizard
Key fields:
| Field | Description |
|---|---|
notification.email_enabled | Toggle email alerts on/off. |
notification.email_recipients | List of email addresses to send alerts to. |
notification.mqtt_enabled | Toggle MQTT alerts on/off (requires an MQTT broker on the node). |
telemetry.disk_alarm_warning_threshold | Disk usage % that triggers a warning alert. |
telemetry.disk_alarm_critical_threshold | Disk usage % that triggers a critical alert. |
Click Send App. Alerts now fire whenever disk usage crosses the thresholds.
Monitor a deployed service
Add an entry to the services array of the App Config to watch a workload on the node. The example below watches the Marketplace MQTT Broker (service name mqttbbr) and triggers an alert if its container goes down for more than 30 seconds and one retry:
{
  "alarmmanager": {
    "debugLevel": "info",
    "notification": {
      "email_enabled": true,
      "email_recipients": ["user@company.tech"],
      "mqtt_enabled": true,
      "summary_enabled": true,
      "summary_time_utc": "16:50"
    },
    "telemetry": {
      "disk_alarm_warning_threshold": 40,
      "disk_alarm_critical_threshold": 90
    },
    "services": [
      {
        "enabled": true,
        "serviceName": "mqttbbr",
        "interval": 30,
        "retries": 1
      }
    ]
  }
}
| Field | Description |
|---|---|
enabled | Toggle this service entry on/off. |
serviceName | The container's service name as declared in its compose file. |
interval | Seconds between health checks. |
retries | Failed checks before the alert fires. |
Open the Docker Compose Info segment of any workload card on the Node Details page. The serviceName is the key under services: of the compose file.
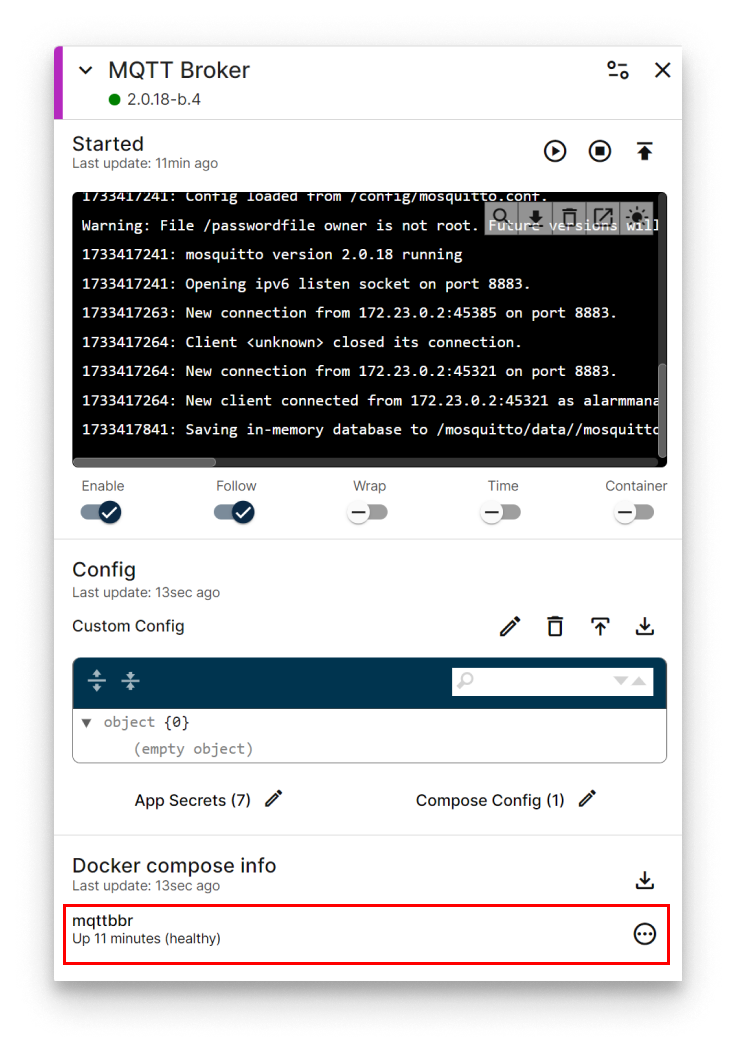
Finding the mqttbbr service name in Docker Compose Info
Monitor external variables over REST
The Alert Manager exposes a REST endpoint at http://alarmmanager:5100/event on the node's barbaraServices network. Any workload on the same node — your own or a Marketplace app — can POST evaluation requests to it.
The payload is a list of event objects:
{
  "enabled": false,
  "name": "Low pressure",
  "deviceDisplayName": "machine_01",
  "displayName": "variable_01",
  "value": 20,
  "operation": "<",
  "threshold": 19,
  "retries": 3
}
Example Python client:
import json
import requests

url = "http://alarmmanager:5100/event"

payload = json.dumps([
    {
        "enabled": True,
        "name": "Low pressure",
        "deviceDisplayName": "machine_00",
        "displayName": "variable_01",
        "value": 18,
        "operation": "<",
        "threshold": 19,
        "retries": 3,
    },
    {
        "enabled": False,
        "name": "Low pressure",
        "deviceDisplayName": "machine_01",
        "displayName": "variable_01",
        "value": 20,
        "operation": "<",
        "threshold": 19,
        "retries": 3,
    },
])

response = requests.post(url, headers={"Content-Type": "application/json"}, data=payload)
print(response.text)
See the app's Technical Notes on Marketplace for the full payload reference.
Use with Marketplace industrial connectors
Every industrial connector in the Barbara Marketplace ships pre-integrated with the Alert Manager — you only need to add the alarm configuration to the connector's App Config to start receiving alerts on its variables.
Browse the connector catalogue and read the per-connector Technical Notes at Industrial Connectors in Barbara Marketplace.
Daily summary email
The Alert Manager can send a once-a-day digest email with every event that occurred in the previous 24 hours. Enable it under notification:
| Field | Description |
|---|---|
notification.summary_enabled | Enable the daily summary email. |
notification.summary_time_utc | Time of day (UTC, HH:MM) when the summary is sent. |
Example:
{
  "alarmmanager": {
    "debugLevel": "info",
    "notification": {
      "email_enabled": true,
      "email_recipients": ["user@company.tech"],
      "mqtt_enabled": false,
      "summary_enabled": true,
      "summary_time_utc": "09:00"
    },
    "telemetry": {
      "disk_alarm_warning_threshold": 75,
      "disk_alarm_critical_threshold": 90
    },
    "services": []
  }
}
Summary
The Alert Manager is the catch-all alerting layer for a Barbara node: telemetry thresholds out of the box, service health checks with retries, and a REST endpoint that lets any app on the barbaraServices network push variables for evaluation. Email and MQTT cover the notification side, with an optional daily summary digest.